HBR Guide to Better Business Writing - Bryan A. Garner 2013
Use graphics to illustrate and clarify
Delivering the goods quickly and clearly
When you’re writing about complex ideas, for example, or looking for useful ways to break up a long stretch of text, you can use a simple, elegant chart to convey critical information at a glance. Such graphics especially serve people who want to skim what you’ve written.
A few crucial principles:
✵ Make sure your graphics illustrate something discussed in the text.
✵ Place them near the text they illustrate, preferably on the same page or on a facing page.
✵ Use legends and keys that readers can easily grasp.
To learn how to produce effective graphics, consult the books of Edward Tufte, especially Envisioning Information and Beautiful Evidence. You’ll marvel at the amount of learning and the sophisticated thought that lie behind superb visuals.
FIGURE 7—1
The Who-Why-What-When-How Chart
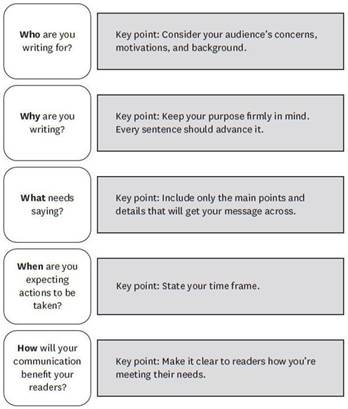
It would be gross negligence to leave off without a graphic, so here’s one to round out the section. Note that when you flip through this book, your eye stops here. That’s because any departure from the norm achieves a special emphasis. If every third or fourth page had such a chart, the effect would be nullified. So make your graphics distinctive—and don’t overuse them.
Recap
✵ Distill your report (or part of it) into a chart, diagram, or other visual aid that helps your audience understand the content and its import.
✵ Take your design cues from visuals you have found effective.
✵ Read the books of Edward Tufte to develop this skill.