A manual for writers of research papers, theses, and dissertations, 7th edition - Kate L. Turabian 2007
Tables - Table structure
Tables and figures
Part III. Style 20 spelling
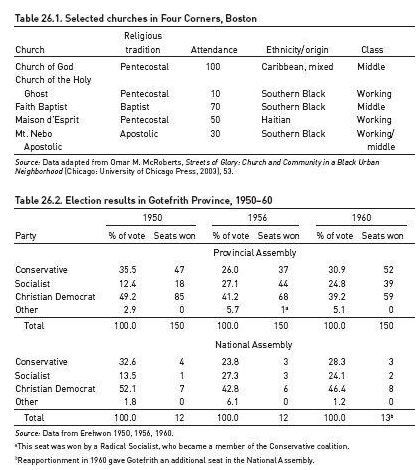
In many situations, you may choose to present data in a table. Chapter 8 describes criteria for using tables as well as general design principles for them. This section covers most of the issues you are likely to encounter in their preparation. Tables 26.1—26.3 provide examples of the principles discussed here.
Tables vary widely in the complexity of their content and therefore in their structure, but consistency both within and across tables is essential to ensure that readers will understand your data.
Use arabic numerals for all numerical data in tables unless otherwise noted. To save space, you can use abbreviations and symbols more freely than you can in text, but use them sparingly and consistently. If standard abbreviations do not exist, create your own and explain them either in a footnote to the table (see 26.2.7) or, if there are many, in a list of abbreviations in your paper's front matter (see A.2.1).
26.2.1 Table structure
A table has elements analogous to horizontal and vertical axes on a graph. On the horizontal axis are column heads. On the vertical axis are headings that constitute what is called the stub column.
This grid of columns (vertical) and rows (horizontal) in a table correlates two sets of variables called independent and dependent. The independent variables are traditionally on the left, in the stub column. The dependent variables are traditionally in the column heads. If you include the same set of variables in two or more tables in your paper, be consistent: put them in the same place in each table, as column heads or in the stub.
The data, which may be words, numbers, or both (see table 26.1), are entered in the cells below the column heads and to the right of the stub column.