A manual for writers of research papers, theses, and dissertations, 7th edition - Kate L. Turabian 2007
Choose Verbal or Visual Representations
Presenting evidence in tables and figures
Part I. Research and writing: from planning to production
If your data are in the form of numbers, most readers grasp them more easily if you present them graphically. But you face many choices of graphic forms, and some forms will suit your data and message better than others. In this chapter, we show you how to choose the right graphic form and design it so that readers can see both what your data are and how they support your argument. (See pp. 414—15 in the bibliography for guides to creating and using graphics; see chapter 26 for details on formatting graphics.)1
8.1 Choose Verbal or Visual Representations
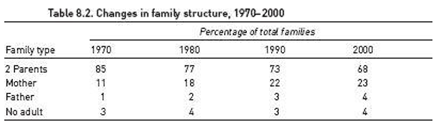
Ordinarily, present quantitative data verbally when they include only a few numbers. (See chapter 23 for presenting numbers in text.) Present them graphically when most of your evidence is quantitative or you must communicate a large set of data. But when the data are few and simple, readers can grasp them as easily in a sentence as in a table like table 8.1:
In 1996, on average, men earned $32,144 a year, women $23,710, a difference of $8,434.
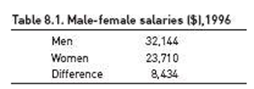
But if you present more than four or five numbers in a passage, readers will struggle to keep them straight, particularly if they must compare them, like this:
Between 1970 and 2000, the structure of families changed in two ways. In 1970, 85 percent of families had two parents, but in 1980 that number declined to 77 percent, then to 73 percent in 1990, and to 68 percent in 2000. The number of one-parent families rose, particularly families headed by a mother. In 1970, 11 percent of families were headed by a single mother. In 1980 that number rose to 18 percent, in 1990 to 22 percent, and to 23 percent in 2000. Single fathers headed 1 percent of the families in 1970, 2 percent in 1980, 3 percent in 1990, and 4 percent in 2000. Families with no adult in the home have remained stable at 3—4 percent.
Those data can be presented more effectively in graphic form, as in table 8.2.