A manual for writers of research papers, theses, and dissertations, 7th edition - Kate L. Turabian 2007
Choose the most effective graphic
Presenting evidence in tables and figures
Part I. Research and writing: from planning to production
When you graphically present data as complex as in that paragraph, you have many choices. The simplest and most common are tables, bar charts, and line graphs, each of which has a distinctive rhetorical effect.
![]() To emphasize specific values, use a table like table 8.2.
To emphasize specific values, use a table like table 8.2.
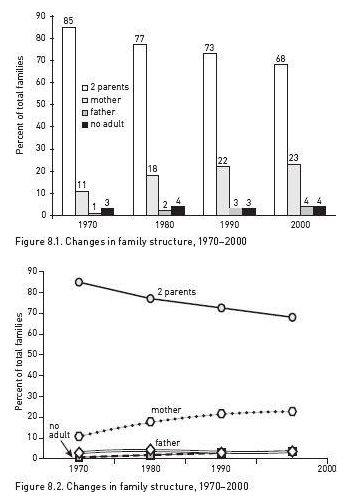
![]() To emphasize comparisons that can be seen at a glance, use a bar chart like figure 8.1 (p. 84).
To emphasize comparisons that can be seen at a glance, use a bar chart like figure 8.1 (p. 84).
![]() To emphasize trends, use a line graph like figure 8.2 (p. 84).
To emphasize trends, use a line graph like figure 8.2 (p. 84).
While each of these forms communicates the same data, readers respond to them in different ways:
![]() A table seems precise and objective. It emphasizes individual numbers and forces readers to infer relationships or trends (unless you state them in an introductory sentence).
A table seems precise and objective. It emphasizes individual numbers and forces readers to infer relationships or trends (unless you state them in an introductory sentence).
![]() Both charts and line graphs emphasize a visual image that communicates values less precisely but more quickly than do the exact numbers of a table. But they also differ:
Both charts and line graphs emphasize a visual image that communicates values less precisely but more quickly than do the exact numbers of a table. But they also differ:
![]() A bar chart emphasizes comparisons among discrete items.
A bar chart emphasizes comparisons among discrete items.
![]() A line graph emphasizes trends, usually over time.
A line graph emphasizes trends, usually over time.
Choose the graphic form that best achieves the effect you intend, not the first one that comes to mind.
How many choices you should consider depends on your experience. If you're new to quantitative research, limit your choices to basic tables, bar charts, and line graphs. Your computer software may offer more choices, but ignore those that you aren't familiar with.
If you are doing advanced research, readers will expect you to use the graphic form best suited to your point and your kind of data, and to draw from a larger range of choices. In that case, consult table 8.7, which describes the rhetorical uses of other common forms. But you may have to consider more creative ways of representing data if you are writing a dissertation or article in a field that routinely displays complex relationships in large data sets.