Rules for writers, Tenth edition - Diana Hacker, Nancy Sommers 2021
Draft the body
Exploring, planning, and drafting
A process for writing
As you draft the body of your essay, you might naturally ask: What should I say? How will I write an entire essay on my topic? You will find the process easier if you have a working thesis to guide the drafting process. If your thesis suggests a plan or if you have sketched a preliminary outline, try to organize your paragraphs accordingly. Draft the body of your essay by writing at least one paragraph about each supporting point you listed in the planning stage.
Remember that first drafts aren’t finished drafts. They are just first, a place to begin. Find your momentum and keep writing.
Asking questions as you draft
As you draft, ask yourself who you are writing for and what points you want to get across. Try to anticipate what your readers might need to know to understand your thesis and follow your train of thought.
Keep these questions in mind as you draft:
✵ Who are my readers?
✵ What is my purpose?
✵ What does my thesis promise readers?
✵ How will I support my thesis?
✵ What evidence do readers need to understand my ideas?
For more detailed help with drafting and developing paragraphs, see section 2.
![]() Using sources responsibly As you draft, keep notes about sources you read and consult (see section 51). If you quote, paraphrase, or summarize a source, include a citation, even in your first draft. You will save time and avoid plagiarism if you do so.
Using sources responsibly As you draft, keep notes about sources you read and consult (see section 51). If you quote, paraphrase, or summarize a source, include a citation, even in your first draft. You will save time and avoid plagiarism if you do so.
Adding visuals as you draft
As you draft, you may decide that some of the support for your thesis would be most effective as a visual. Visuals can convey information concisely and powerfully. Graphs and tables, for example, can simplify complex numerical information. Images — including photographs and diagrams — often express ideas vividly. Keep in mind that if you use a visual from one of your sources or use published information to create your own visual, you must credit the source. Also, be sure to choose visuals to supplement your ideas, not to substitute for them.
The chart in this section describes eight types of visuals and their purposes.
![]() Using sources responsibly If you create a chart, timeline, or other visual using information from your research, cite the source of the information even though the visual is your own. If you download a photograph from the web, credit the person or organization that created it.
Using sources responsibly If you create a chart, timeline, or other visual using information from your research, cite the source of the information even though the visual is your own. If you download a photograph from the web, credit the person or organization that created it.
CHOOSING VISUALS TO SUIT YOUR PURPOSE
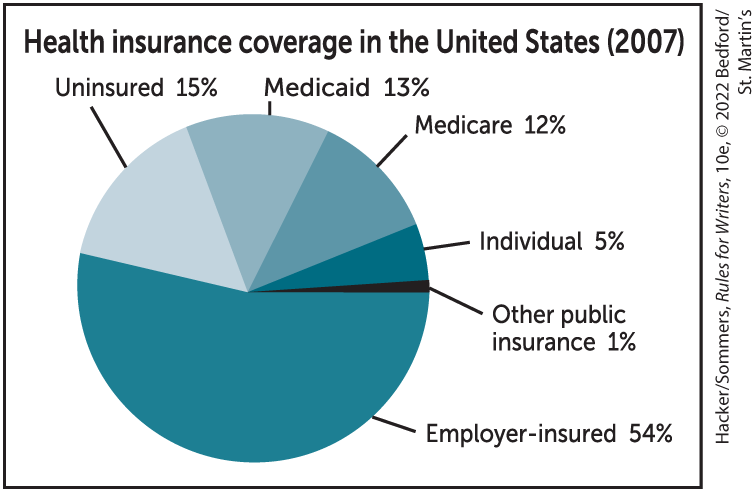
Pie chart
Pie charts compare a part or parts to the whole. Segments of the pie represent percentages of the whole (and always total 100 percent).
![]()
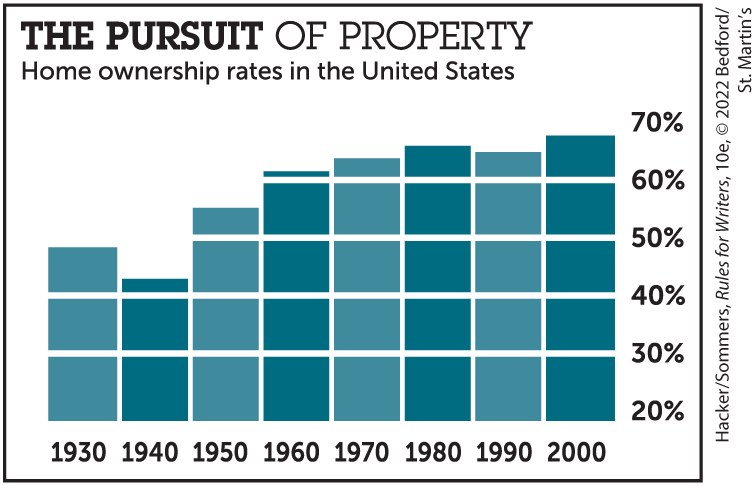
Bar graph (or line graph)
Bar graphs highlight trends over a period of time or compare numerical data. Line graphs display the same data as bar graphs; the data are graphed as points, and the points are connected with lines. (The image shown here is a bar graph; see page 102 for a line graph.)
![]()
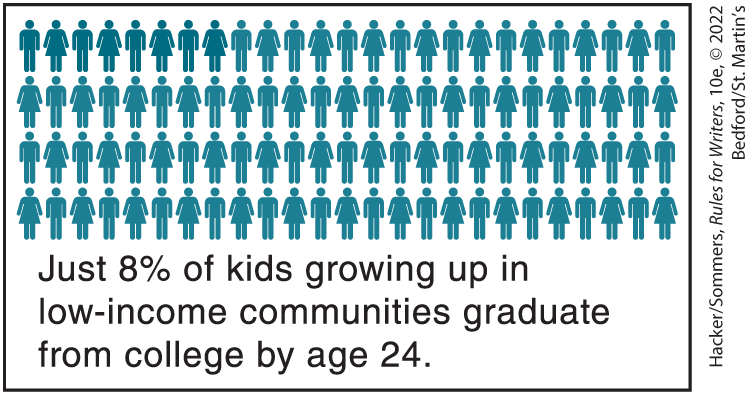
Infographic
An infographic presents data in a visually engaging form. The data are usually numerical, as in bar graphs or line graphs, but they are represented by a graphic element rather than bars or lines.
![]()
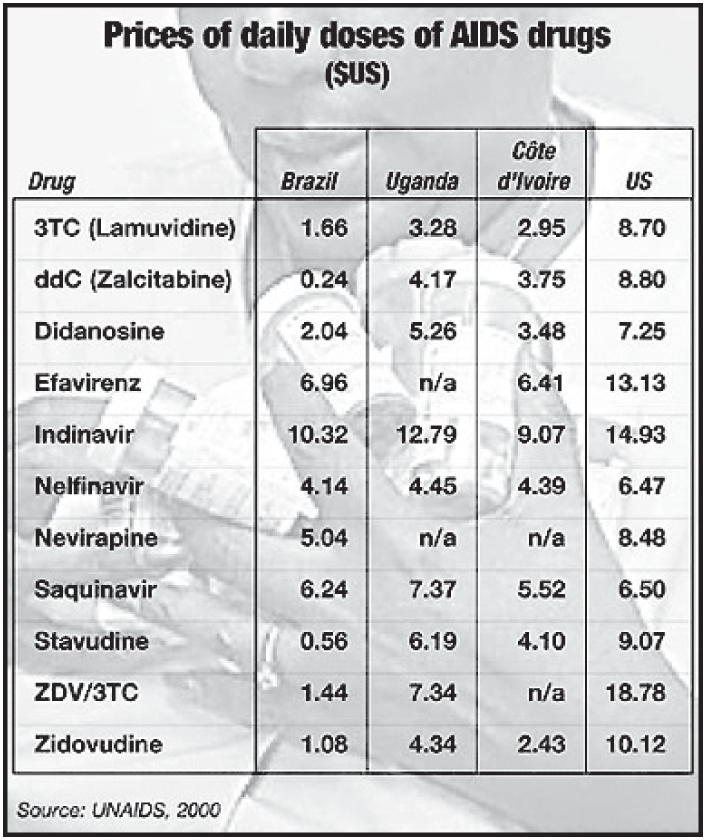
Table
Tables display numbers and words in columns and rows. They can be used to organize complicated numerical information into an easily understood format.
![]()
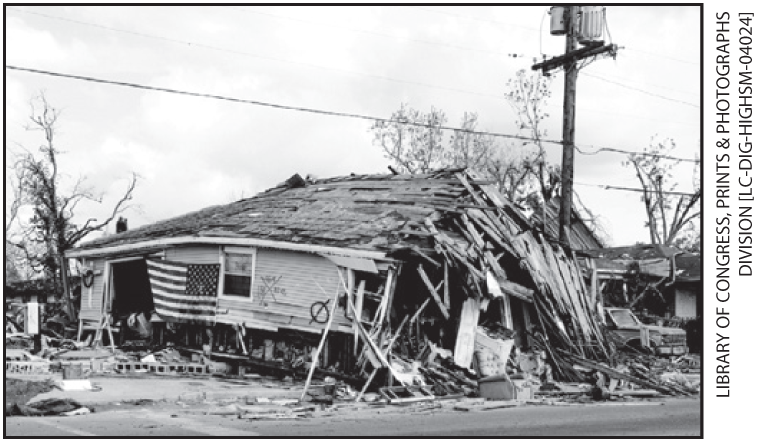
Photograph
Photographs vividly depict people, scenes, or objects discussed in a text.
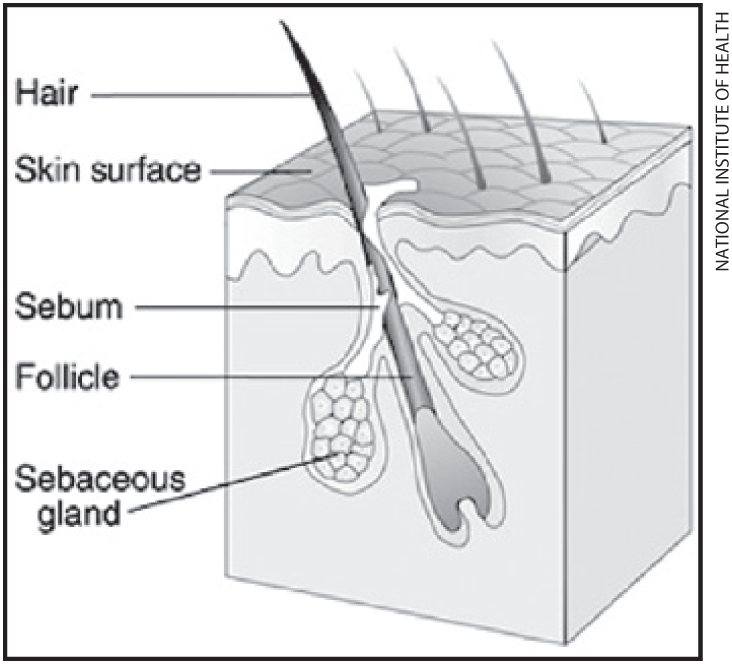
Diagram
Diagrams, useful in scientific and technical writing, concisely illustrate processes, structures, or interactions.
![]()
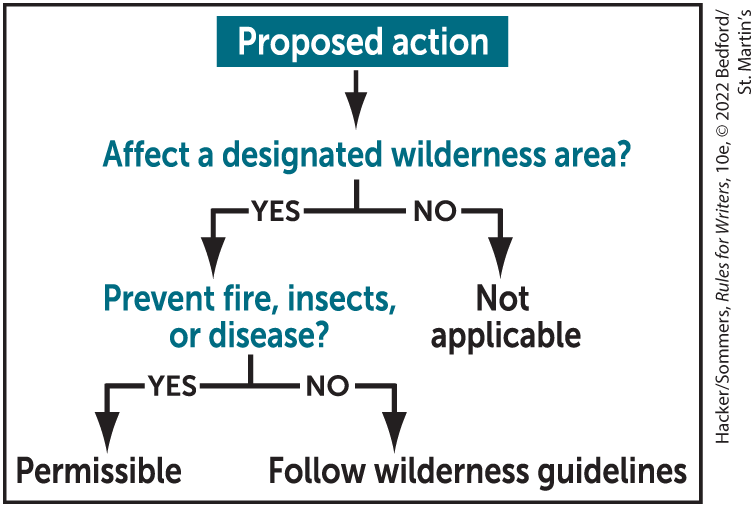
Flowchart
Flowcharts show structures (the hierarchy of employees at a company, for example) or steps in a process and their relation to one another. (See also p. 125 for another example.)
![]()
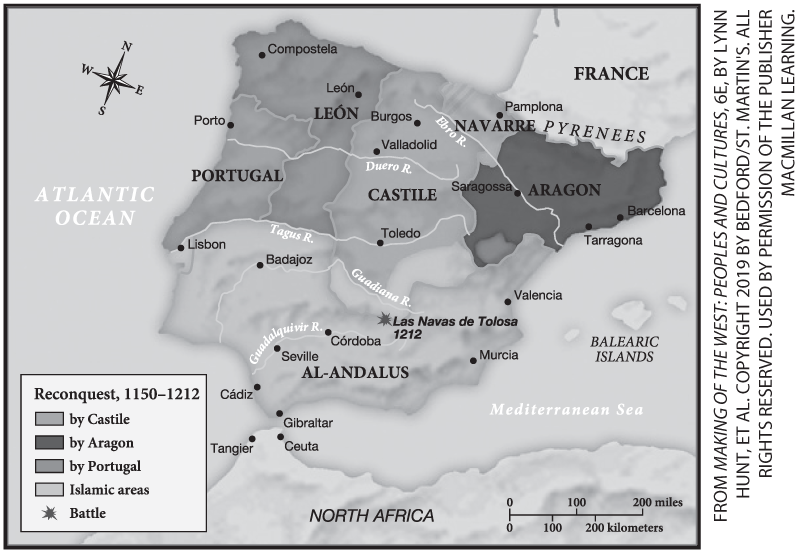
Map
Maps illustrate distances, historical information, or demographics and often use symbols for geographic features and points of interest.
![]()