Success in Academic Writing - Trevor Day 2018
Other kinds of figure
Words and images
Line graphs, scatter plots, bar charts, histograms and pie charts are just a few of the many ways of displaying information visually. Others include maps, Gantt charts (Section 1.3), mind maps, concept maps, flow charts (Section 5.7) and organisational charts. And then there are various kinds of line drawing, ranging from sketches and anatomical drawings to architectural plans and high-accuracy engineering and design drawings. Added to this are photographs and composite figures (figures that display information in more than one way, such as a map with histograms superimposed on it).
The various ways of depicting information visually cannot all be considered in this book, and the reader is referred to Tufte (2001), Nicol and Pexman (2010a, 2010b) and the Open University (2017) for further information. Advice on using software to generate figures is given in Section 11.4.
Key points in the chapter
1Visual elements, such as tables and figures, complement text in many kinds of assignment.
2There are conventions for how visual elements are displayed and referred to in academic writing.
3Tables can be effective for comparing and contrasting numerical and sometimes written information in a summary form.
4Graphs and charts - such as line graphs, scatter plots, bar charts, histograms and pie charts - can be effective for displaying trends or patterns in numerical data.
5Visual elements, such as tables and graphs, need to be integrated with the document’s text. They should be referred to in the text, and complement rather than repeat information given in the text.
Cited references
Day, T. (2008). Oceans. Revised edition. New York: Facts On File.
Nicol, A. A. M. and Pexman, P. M. (2010a). Displaying Your Findings: A Practical Guide for Creating Tables. 6th edn. Washington: American Psychological Association.
Nicol, A. A. M. and Pexman, P. M. (2010b). Displaying Your Findings: A Practical Guide for Creating Figures, Posters and Presentations. 6th edn. Washington: American Psychological Association.
The Open University (2017). OpenLearn Online Unit: More Working with Charts, Graphs and Tables. Milton Keynes: The Open University. Available from: www.open.edu/openlearn/science- maths-technology/mathematics-and-statistics/mathematics-education/more-working-charts-graphs- and-tables/content-section-0 [accessed 10 August 2017].
Tufte, E. R. (2001). The Visual Display of Quantitative Information. 2nd edn. Cheshire: Graphics Press.
UNCTAD (2016). Review of Maritime Transport. Geneva, Switzerland: United Nations Conference on Trade and Development (UNCTAD). Available from: http://unctad.org/en/pages/PublicationWebflyer.aspx?publicationid=1650 [accessed 10 August 2017].
Further reading
Duarte, N. (2010). Resonate: Present Visual Stories that Transform Audiences. Hoboken: John Wiley & Sons.
Answers for Chapter 8
Activity 8.1: Improving a table
The table could be improved in these three ways:
✵The source of the data is not cited. This could be done either at the end of the table title or in a
footnote.
✵Dead-weight tonnage is best defined. It is a measure of how much weight a ship can safely carry (carrying capacity), including cargo, fuel, ballast water, provisions, fresh water, passengers and crew.
✵The countries/territories are ordered alphabetically. They would be more logically listed in order of fleet size or total dead-weight tonnage.
A revised table, incorporating these three features, is shown below:
Table 8.4 The ten countrles/terrltorles with the largest owned fleets as of 1 January 2016 (UNCTAD, 2016, p. 37)
Country/terrltory of ownership |
Number of national flag vessels |
Number of foreign flag vessels |
Total number of vessels |
Total dead-weight* tonnage (thousands of tonnes) |
|
Greece |
728 |
3,408 |
4,136 |
293,087 |
|
japan |
835 |
3,134 |
3,969 |
228,980 |
|
China |
3,405 |
1,915 |
4,960 |
158,884 |
|
Germany |
240 |
3,121 |
3,361 |
119,181 |
|
Singapore |
1,499 |
1,054 |
2,553 |
95,312 |
|
Hong Kong (China) |
854 |
594 |
1,448 |
87,375 |
|
Republic of Korea |
795 |
839 |
1,634 |
78,834 |
|
United States |
782 |
1,213 |
1,995 |
60,279 |
Bermuda |
14 |
404 |
418 |
48,453 |
|
United Kingdom |
332 |
997 |
1,329 |
48,453 |
*Dead-weight is a measure of how much weight a ship can safely carry (carrying capacity). It includes cargo, fuel, ballast water, provisions, fresh water, passengers and crew.
Activity 8.2: Improving a chart
The bar chart could be improved in three ways:
✵The vertical (y axis) scale does not begin at zero, giving an exaggerated impression of the difference in scores between males and females. Using a full scale would make the difference much less evident.
✵The vertical (y axis) scale is unlabelled. Presumably it refers to the overall percentage marks obtained on the course.
✵In addition, the chart would be more meaningful if standard errors were shown, indicating the distribution of marks for each category.
A revised chart, incorporating these three features, is shown in Figure 8.7:
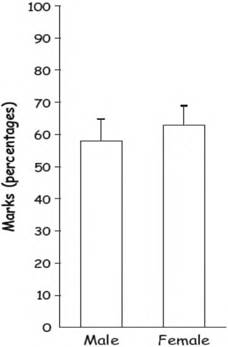
Figure 8.7 A comparison of the mean percentage score of male (n = 45) and female (n = 48) students on the Art and Protest module. The standard errors about the mean are indicated. Based on hypothetical data