How to write and publish a scientific paper - Barbara Gastel, Robert A. Day 2022
When to use graphs
How to prepare effective graphs
Preparing the tables and figures
Graphs resemble tables in that they are a means of presenting data in an organized way. In fact, the results of many experiments can be presented either as tables or as graphs. How do we decide which is preferable? This is often a difficult decision. A good rule might be this: If the data show pronounced trends, making an interesting picture, use a graph. If the numbers just sit there, with no exciting trend in evidence, a table should be satisfactory (and perhaps easier and cheaper for you to prepare). Tables are also preferred for presenting exact numbers.
Examine Table 17.1 and Figure 17.2, both of which record exactly the same data. Either format would be acceptable for publication, but Figure 17.2 clearly seems superior to Table 17.1. In the figure, the synergistic action of the two-drug combination is immediately apparent. Thus, the reader can quickly grasp the significance of the data. It also appears from the graph that streptomycin is more effective than is isoniazid, although its action is somewhat slower; this aspect of the results is not readily apparent from the table.
Table 17.1. Effect of Streptomycin, Isoniazid, and Streptomycin Plus Isoniazid on Mycobacterium tuberculosisa
|
Percentage of Negative Cultures at |
||||||||
|
Treatmentb |
2 weeks |
4 weeks |
6 weeks |
8 weeks |
||||
Streptomycin |
5 |
10 |
15 |
20 |
||||
Isoniazid |
8 |
12 |
15 |
15 |
||||
Streptomycin + Isoniazid |
30 |
60 |
80 |
100 |
||||
aThe patient population, now somewhat less so, was described in a preceding paper (61).
bHighest quality available from our supplier (Town Pharmacy, Podunk, IA).
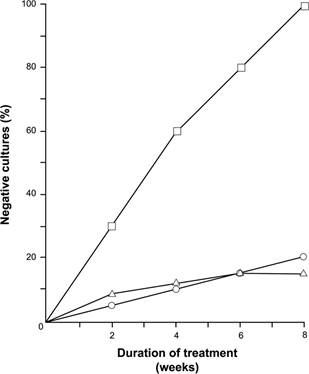
Figure 17.2. Effect of streptomycin (Ο), isoniazid (Δ), and streptomycin plus isoniazid (□) on Mycobacterium tuberculosis.