How to write and publish a scientific paper - Barbara Gastel, Robert A. Day 2022
How to prepare graphs
How to prepare effective graphs
Preparing the tables and figures
Early editions of this book included rather precise directions for using graph paper, India ink, lettering sets, and the like. Graphs had been prepared with these materials and using these techniques for generations.
Today, though, we prepare graphs by computer. However, the principles of producing good graphs have not changed. The sizes of the letters and symbols, for example, must be chosen so that the final published graph in the journal is clear and readable.
The size of the lettering must be based on the anticipated reduction that will occur in the publishing process. This factor can be especially important if you are combining two or more graphs into a single illustration. Remember: Text that is easy to read on a large computer screen may become illegible when reduced to the width of a journal column. If you are preparing a graph on a computer, reduce it to the size at which you would expect it to appear in the journal (or the size at which you would expect readers to read it on a small screen), and make sure that it still is legible.
Each graph should be as simple as possible. “The most common disaster in illustrating is to include too much information in one figure. Too much information in an illustration confuses and discourages the viewer” (Briscoe 1996, p. 6).
Figure 17.3 is a nice graph. The lettering is large enough to read easily. It is boxed, rather than two-sided (compare with Figure 17.2), making it a bit easier to estimate the values on the right side of the graph. The scribe marks point inward rather than outward.
If your paper contains two or more graphs that are most meaningful when viewed together, consider grouping them in a single illustration. To maximize readability, place the graphs above and below each other rather than side by side. For example, in a two-column journal, placing three graphs in an “above and below” arrangement allows each graph to be one or two columns in width. If the graphs appear side by side, each can average only one third of a page wide.
Whether or not you group graphs in such a composite arrangement, be consistent from graph to graph. For example, if you are comparing interventions, keep using the same symbol for the same intervention. Also, be consistent in other aspects of design. Both conceptually and aesthetically, the graphs in your paper should function as a set.
Do not extend the axes (or the explanatory wording) beyond what the graph demands. For example, if your data points range between 0 and 78, your topmost index number should be 80. You might feel a tendency to extend the graph to 100, a nice round number; this urge is especially difficult to resist if the data points are percentages, for which the natural range is 0 to 100. Resist this urge, however. If you do not, parts of your graph will be empty; worse, the live part of your graph will then be restricted in dimension because you have wasted perhaps 20 percent or more of the width (or height) with white space.
In the preceding example (data points ranging from 0 to 78), your reference numbers should be 0, 20, 40, 60, and 80. You should use short index lines at each of these numbers, and also at the intermediate 10s (10, 30, 50, 70). Obviously, a reference stub line halfway between 0 and 20 could only be 10. Thus, you need not label the 10s, and you can then use larger lettering for the 20s, without squeezing. By using such techniques, you can make graphs simple and effective instead of cluttered and confusing.
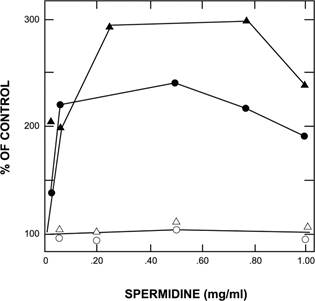
Figure 17.3. Effect of spermidine on the transformation of B. subtilis BR 151. Competent cells were incubated for 40 min with spermidine prior to the addition of 5 μg of donor DNA per ml (●) or 0.5 μg of donor DNA per ml (▲). DNA samples of 5 μg (Ο) or 0.5 μg per ml (Δ) were incubated for 20 min prior to the addition of cells. (Redrawn from Fig. 1 in Clark PO and Leach FR. Stimulation of Bacillus subtilis transformation by spermidine. Mol. Gen. Genet. 178:21—25, 1980. © by Springer-Verlag 1980. With permission of Springer.)