PSAT 8/9 Prep with 2 practice tests - Princeton Review 2020
Chapter 10 Math basics
Part III PSAT 8/9 Prep
Although we’ll show you which mathematical concepts are most important to know for the PSAT 8/9, this book relies on your knowledge of basic math concepts. If you’re a little rusty, this chapter is for you. Read on for a review of the math basics you’ll need to know before you continue.
HOW TO CONQUER PSAT 8/9 MATH
So what do you need to do? There are three important steps:
1. Know the basic content. Obviously you do need to know the basics of arithmetic and algebra. We’ll cover what you need to know in this chapter.
2. Learn some PSAT 8/9-specific problem-solving skills. Since these basic concepts appear in ways you’re probably not used to from math class, you need to prepare yourself with a set of test-specific problem-solving skills designed to help you solve PSAT 8/9 Math problems. We’ll cover the most important ones in the next chapter.
3. Have a sound overall testing strategy. This means knowing what to do with difficult questions or when calculator use is not allowed, and having a plan to pace yourself to get the maximum number of points in the time allotted. Be sure to read carefully the material in Chapter 2 to make sure you’re using the strategy that will get you the greatest number of points in the time you have.
(PERSONAL) ORDER OF DIFFICULTY

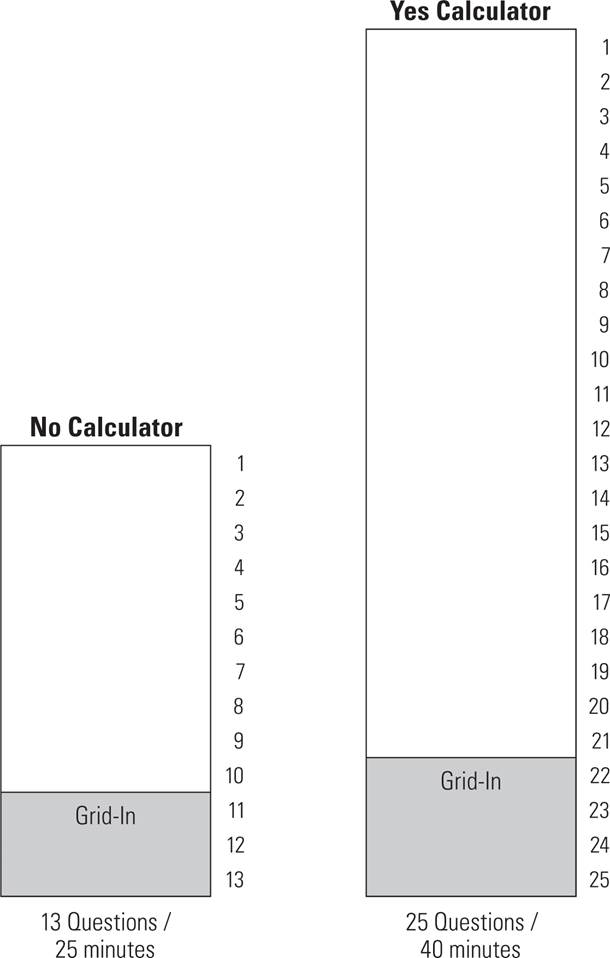
The Math sections on the PSAT 8/9 are Sections 3 and 4. Section 3 contains 10 multiple-choice questions and 3 Grid-In questions. Section 4 contains 21 multiple-choice questions and 4 Grid-In questions. Within each question type, there is a loose order of difficulty, with most of the questions being of medium difficulty. (This means that the first few multiple-choice and first Grid-In questions are likely to be rated as easy, and the last few multiple-choice and last Grid-In questions are typically considered the most difficult.) More important than any order of difficulty is your own Personal Order of Difficulty. Though the last questions of each type in a section are likely to be the hardest, use your own personal strengths and weaknesses to decide which questions to do and which to skip.
USING YOUR CALCULATOR
You are allowed to use a calculator on Section 4 of the PSAT 8/9, and you should definitely do so. You can use any graphing, scientific, or plain old four-function calculator, provided that it doesn’t have a keyboard.

Not sure whether your calculator is acceptable? Check College Board’s website for a list of approved calculators.
There are a few simple rules to remember when dealing with your calculator:
1. Use the calculator you’re most comfortable with. You definitely don’t want to be trying to find the right button on test day. Ideally, you should be practicing with the same calculator you’ll use on test day.
2. Change or charge your batteries the week before the test. If they run out during the test, there’s nothing you can do about it.
3. Be sure to hit the “clear” or “on/off” button after each calculation to reset the calculator after an operation. A common mistake to make when using your calculator is to forget to clear your last result.
4. Your calculator is very good at calculating, but watch out for mis-keying information. (If you type the wrong numbers in, you’ll get the wrong result.) Check each number on the display as you key it in.
5. For the most part, you’ll use your calculator for the basic operations of addition, subtraction, multiplication, and division; the ability to convert fractions to decimals and vice versa; and the ability to do square roots and exponents. Don’t forget, though, that it likely has handy buttons for things like sine, cosine, and i, should you encounter those on the test.
6. Then, there’s one really big, important rule whenever you think about using your calculator:
A calculator can’t think; it can only calculate.
What does this mean? It means that a calculator can’t think through a problem for you. You have to do the work of understanding and setting up the problem correctly to make sure you know what the right calculation will be to get the answer. Only then can you use the calculator, when it is allowed, to calculate the answer.
So use your paper and pencil to practice your problem-solving skills on all Math questions. You should always be sure to set up the problem in your test booklet—writing it down is still the best method—which will help you catch any errors you might make and allow you to pick up where you left off if you lose focus. Then, for questions in Section 4, move quickly to your calculator to chug your way through the calculations, and be careful to enter each number and operator correctly. Remember, using your calculator is already saving you time on these questions—don’t rush and lose the advantage that it gives you.
As you work through this book, look for calculator symbols next to questions on which calculator use would be allowed. If you don’t see the symbol, don’t use your calculator!
Math Basics Drill 1
DEFINITIONS
One of the reasons that good math students often don’t get the credit they deserve on the PSAT 8/9 is that they’ve forgotten one or more of these definitions—or they read too fast and skip over these “little” words. Be sure you know them cold and watch out for them!
Match the words with their definitions, and then come up with some examples. Answers can be found in Part IV.
1.integers 2.positive numbers 3.negative numbers 4.even numbers 5.odd numbers 6.factors 7.multiples 8.prime numbers 9.distinct 10.digit 11.consecutive numbers 12.divisible 13.remainder 14.sum 15.product 16.difference 17.quotient 18.absolute value |
a. numbers that a certain number can be divided by, leaving no remainder Examples: b. integers that cannot be divided evenly by 2 Examples: c. numbers that have no fractional or decimal parts Examples: d. numbers that are greater than zero Examples: e. having a different valu Examples: f. integers that can be divided by 2 evenly (with no remainder) Examples: g. numbers that are less than zero Examples: h. numbers that have exactly two distinct factors: themselves and 1 Examples: i. numbers that can be divided by a certain number with no remainder Examples: j. a figure from 0 through 9 that is used as a placeholder Examples: k. the result of addition Examples: l. a whole number left over after division Examples: m. the result of subtraction Examples: n. can be divided with no remainder Examples: o. a number’s distance from zero; always a positive value Examples: p. numbers in a row Examples: q. the result of division Examples: r. the result of multiplication Examples: |
EQUATIONS AND INEQUALITIES
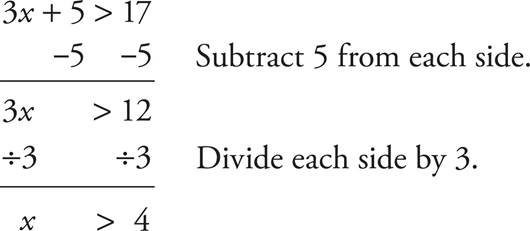
An equation is a statement that contains an equals sign, such as 3x + 5 = 17.
To solve an equation, you must get the variable x alone on one side of the equals sign and everything else on the other side.
The first step is to put all of the variables on one side of the equation and all of the numbers on the other side, using addition and subtraction. As long as you perform the same operation on both sides of the equals sign, you aren’t changing the value of the variable.
Then you can divide both sides of the equation by the coefficient, which is the number in front of the variable. If that number is a fraction, you can multiply everything by its reciprocal.
For example,

Always remember the rule of equations:
Whatever you do to one side of the equation, you must also do to the other side.
The example above was fairly simple. The PSAT 8/9 may test this idea with more complex equations and formulas, though. Just keep trying to isolate the variable in question by undoing the operations that have been done to it. Here’s an example.
![]()
7.In the equation T = UVW, all variables are positive. Which of the following expresses W in terms of the variables T, U, and V?
A) 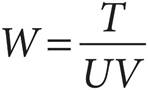
B)W = TUV
C)W = T — UV
D)W = UV — T
Here’s How to Crack It
The question asks for one variable in an equation in terms of the others. To isolate W, which is multiplied by U and V, divide both sides of the equation by U and V. The result is 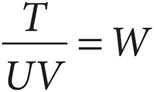 . Flip the two sides of this equation to get
 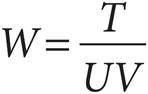 . The correct answer is (A).
![]()
An inequality is any statement with one of these signs:
< (less than)
> (greater than)
≤ (less than or equal to)
≥ (greater than or equal to)
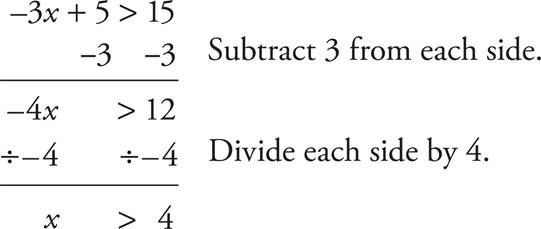
You can solve inequalities in the same way you solve equations, with one exception: whenever you multiply or divide an inequality by a negative value, you must change the direction of the sign: < becomes >, and ≤ becomes ≥.
For example,
In this case, we didn’t multiply or divide by a negative value, so the direction of the sign didn’t change. However, if we were to divide by a negative value, we would need to change the direction of the sign.
Now let’s look at how the PSAT 8/9 may make this more complicated with a question about a range of values.
![]()
8 ≥ 2x — 6
4.The inequality above can be expressed as which of the following?
A)x ≤ 2
B)x ≤ 4
C)x ≤ 6
D)x ≤ 7
Here’s How to Crack It
The question asks for an inequality to be solved for a variable. Treat inequalities as you would equations, isolating the variable and performing the same operations on both sides. Start by adding 6 to both sides of the inequality to get 14 ≥ 2x, then divide both sides by 2 to get 7 ≥ x. The answer choices have x on the left side if the inequality, so just flip this to get x ≤ 7. If there were also an answer of x ≥ 7 as an option, you’d have to make sure that you flipped the inequality sign properly, but that’s not an issue here. The correct answer is (D).
![]()
SIMULTANEOUS EQUATIONS
Simultaneous equations occur when you have two equations at the same time. Occasionally, all you have to do is stack the equations, and then add or subtract them, so try that first. Sometimes, it won’t get you exactly what you want, but it will get you close to it.
![]()
—c + d = 5
c + 2d = 13
8.What is the value of c if the solution to the system of equations above is (c, d)?
A) 1
B) 6
C) 8
D)18
Here’s How to Crack It
The question asks for the value of c in the system of equations. Stacking and adding the equations will not give you the value of c, but it will make the c terms disappear, making it easy to solve for d.
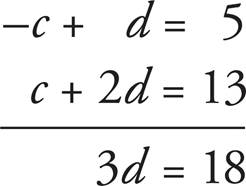
Now divide both sides by 3 to get d = 6. Plug this into the first equation to get —c + 6 = 5, then subtract 6 from both sides to get —c = —1. Multiplying both sides by —1 gives you c = 1. The correct answer is (A).
![]()
That was pretty simple, but simultaneous equations on the PSAT 8/9 can be tougher. Let’s look at a really challenging one.
![]()
22.A debate team takes part in 12 different debates over a season. A win is worth 3 points and a loss is worth 1 point for participation. There are no ties. If the debate team scores a total of 30 points over the season, what is the difference between their number of wins and number of losses for the season?
Here’s How to Crack It
The question asks for the difference between wins and losses for a debate team. Read the information in the question carefully to translate it into equations that can be solved. Start with a straightforward piece of information, such as the fact that there were 12 debates. There were only wins and losses, no ties, so represent wins with w and losses with l. You can translate the first sentence as w + l = 12. Now you can move on to the points, of which the team scored 30 in total. The team got 3 points for every win, so those points can be represented as 3w. The team got 1 point for every loss, so those points can be written as 1l or just l. This makes the second equation 3w + l = 30. Since the l term in both equations has no coefficient, that will be the easiest term to eliminate. To do so, multiply the first equation by —1 to get —w — l = —12. Now stack and add the equations.
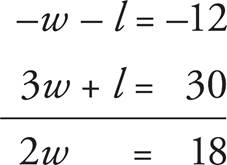
Now divide both sides of the resulting equation by 2 to get w = 9. Plug this into the original version of the first equation to get 9 + l = 12, so l = 3. Finally, the question asks for the difference in numbers of wins and losses, so subtract to get 9 — 3 = 6. The correct answer is 6.
![]()
WRITING YOUR OWN EQUATIONS
For the most part, we’ve been looking at solving equations given to you in questions. That last question, though, required you to create one of your own. The PSAT 8/9 Math sections are testing not only your math skills, but also, and possibly even more important to your score improvement, your reading skills. It is imperative that you read the questions carefully and translate the words in the problem into mathematical symbols.
English |
Math Equivalents |
is, are, were, did, does, costs |
= |
what (or any unknown value) |
any variable (x, y, k, b) |
more, sum |
+ |
less, difference |
— |
of, times, product |
× (multiply) |
ratio, quotient, out of, per |
÷ (divide) |
Sometimes you’ll be asked to take a word problem and create equations or inequalities from that information. Usually they will not ask you to solve these equations/inequalities, so if you are able to locate and translate the information in the problem, you have a good shot at getting the correct answer. Always start with the most straightforward piece of information. What is the most straightforward piece of information? Well, that’s up to you to decide. Consider the following problem.
![]()
3.Drew is distributing water bottles during a marathon. She starts with 3,500 bottles of water and distributes an average of 70 bottles each hour. Which of the following best demonstrates the relationship between the remaining number of water bottles, w, and the amount of time h, in hours, Drew spends distributing water bottles?
A)w = 3,500h — 70
B)w = 3,500 — 70h
C)h = 3,500 — 70w
D)h = 3,500w — 70
Here’s How to Crack It
The question asks for an equation to model a relationship between variables. Start with an easy piece of information—Drew starts with 3,500 bottles of water, and then she gives some away. This means that the correct equation must have 3,500 in it, then some value subtracted from it.
Unfortunately, all the equations have some piece like this, so translate another piece. The variable w is defined as the number of remaining water bottles, so the equation should be set equal to w. Eliminate (C) and (D), as those two are in terms of h. Now determine where the h should go, since that’s the only difference between (A) and (B). Drew hands out 70 water bottles per hour, with h representing the number of hours. This means that the equation must include the term 70h. Eliminate (A). The correct answer is (B).
![]()
Now let’s look at harder one. The following question has a lot more words and more than one inequality in each answer choice. This makes it even more important to translate one piece at a time and eliminate after each step.
![]()
5.A sports memorabilia store sells a number of rare cards, r, for $20 each. It also sells a number of common cards, c, for $2 each. On a given day, a sports enthusiast purchases 40 cards for a total of $296. Which of the following systems of equations illustrates the relationship between r and c?
A) 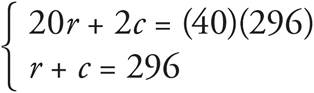
B) 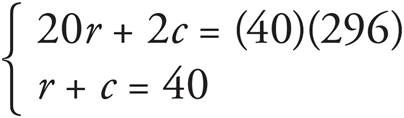
C) 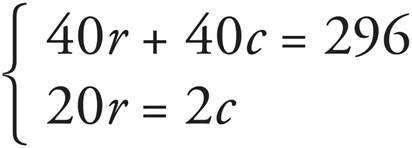
D) 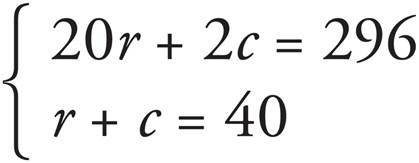
Here’s How to Crack It
The question asks for the system of equations that represents the situation. Rather than taking the time to create your own system based on the information, then looking to match yours to one of the answer choices, use Bite-Sized Pieces and Process of Elimination. Just translate one small, straightforward piece, such as the fact that 40 cards were sold. Those cards were either rare, represented by r, or common, represented by c. Therefore, one equation must be r + c = 40. Eliminate any answers that don’t include this equation, such as (A) and (C). Now, rather than translating the other equation needed, take a moment to compare the remaining answers. The difference between the two is that (B) has (40)(296) as the right side of the first equation, while (D) only has 296 there. The number 296 appears in the question as the total amount of money the sports enthusiast spent, so this value should not be multiplied by 40, the number of cards purchased (the enthusiast did NOT spend $296 on of each of the cards). Thus, you can eliminate (B) and know that the correct answer is (D). Using POE in small pieces this way is very efficient!
![]()
Math Basics Drill 2
Answers can be found in Part IV.
3.Which of the following values is 6 less than 5 times itself?
A)1
B) ![]()
C)5
D)6
5.David is trying to take up to 31 unique photos, one for each day in January. He has already taken 4 nature photos and 7 architectural photos. Which of the following inequalities represents all possible values of p if p represents the remaining number of photos David could take over the month of January?
A)0 ≤ 31 — (4 + 7) — p
B)31 ≤ p — 11
C)0 ≥ 31 — (4 + 7) — p
D)31 ≥ p — 11
9.If 8(2 — x) = 10 — 5(x + 3), what is the value of x?
A)1
B) 
C)7
D) 
7.What value of c is a solution to the equation —3c — 2 + 9 = c — 2 — 3c?
A)—9
B)—2
C) 2
D) 9
2a — b = 11
4a — b = 7
10.What is the value of a if the solution to the system of equations above is (a, b)?
A) 4
B) 6
C) —2
D)—15
— (x2 — 2) + x4 + (2x2 — 8)
19.Which of the following expressions is equivalent to the expression above?
A)x4 + x2 — 6
B)x4 + x2 — 10
C)x4 — x2 — 10
D)2x8 — 6
20.Bill can purchase eight hockey pucks and two water bottles for $22 or twelve hockey pucks and ten water bottles for $54. For his team’s hockey practice, Bill needs sixteen water bottles. How much will it cost for Bill to purchase the sixteen water bottles given the above costs?
A)$20
B)$22
C)$48
D)$54
THE COORDINATE PLANE
You will definitely see some questions on the coordinate plane, or xy-plane, on the PSAT 8/9. Let’s start by covering the basics here. You’ll see more advanced concepts in the Advanced Math chapter. So let’s just review:
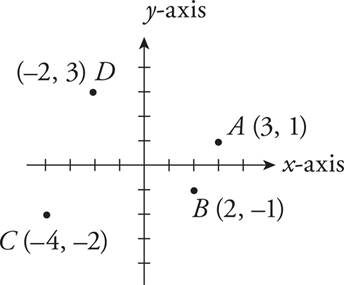
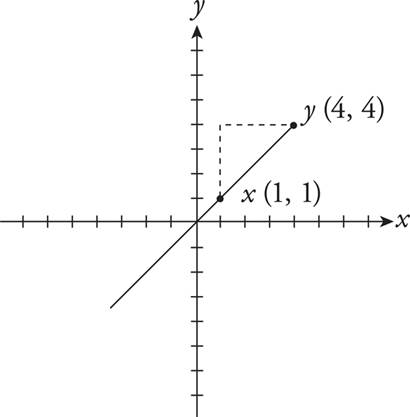
The x-axis is the horizontal axis, and the y-axis is the vertical axis. Points are given on the coordinate plane with the x-coordinate first. Positive x-values go to the right, and negative ones go to the left; positive y-values go up, and negative ones go down. So point A (3, 1) is 3 points to the right on the x-axis and 1 point up from the y-axis. Point B (2, —1) is 2 points to the right on the x-axis and 1 point down from the y-axis.
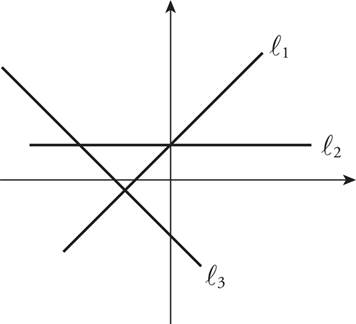
Slope is a measure of the steepness of a line on the coordinate plane. On most slope problems, you need to recognize only whether the slope is positive, negative, or zero. A line that goes up and to the right has positive slope; a line that goes down and to the right has negative slope, and a flat line has zero slope. In the figure below, l1 has positive slope, l2 has zero slope, and l3 has negative slope.
If you do need to calculate the slope, and the graph is drawn for you, here’s how: 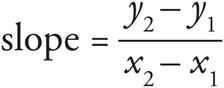 . The slope of a line is equal to
 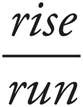 . To find the slope, take any two points on the lines and count off the distance you need to get from one of these points to the other.
In the graph above, to get from point x to point y, we count up (rise) 3 units, and count over (run) 3 units. Therefore, the slope is  . Always remember to check whether the slope is positive or negative when you use
  .
.
If you’re not given a figure and you can’t draw one easily using the points given, you can find the slope by plugging the coordinates you know into the slope formula. Just remember to plug the numbers into the formula carefully!
Knowing how to find the slope is useful for solving questions about perpendicular and parallel lines. Perpendicular lines have slopes that are negative reciprocals of one another. Parallel lines have the same slope and no solutions. You may also be given two equations that have infinitely many solutions.
Take a look at an example.
![]()
15x — 12y = 63
ay + 5x = 21
19.The system of equations above has infinitely many solutions. If a is a constant, what is the value of a?
A)—12
B) —4
C) —3
D) 3
To Infinity…and Beyond!
When given two equations with infinitely many solutions, find a way to make them equal. The equations represent the same line.
Here’s How to Crack It
The question asks for the value of a in a system of equations with infinitely many solutions. The equations are in the standard form of a line, Ax + By = C, so they represent two lines in the xy-plane. The only way for a system of two lines to have infinitely many solutions is if the two equations represent the same line. The problem is that these two equations don’t really look the same. Start by rearranging the terms in the second equation to be in the same order as the first equation. The second equation becomes 5x + ay = 21. You may notice that 5x can be multiplied by 3 to get to 15x. The same holds true for the right side of the second equation (if you multiply the 21 by 3, you get 63). Therefore, you should multiply the entire second equation by 3 to get it looking more like the first equation. The result is 15x + 3ay = 63. Now each term can be compared easily, and the —12y in the first equation is equal to the 3ay in the second equation. Therefore, —12y = 3ay, and you can divide both sides of that equation by 3y to get —4 = a. The correct answer is (B).
![]()
The equation of a line can take multiple forms. The most common of these is known as the slope-intercept form. If you know the slope and the y-intercept, you can create the equation of a given line. A slope-intercept equation takes the form y = mx + b, where m is the slope and b is the y-intercept.
![]()
Here’s an example.
y = ![]() x + 6
x + 6
3.The graph of the equation above in the xy-plane crosses the y-axis at (0, b). What is the value of b?
A) ![]()
B) ![]()
C)3
D)6
Here’s How to Crack It
The question asks for the value of b, the y-coordinate of the point where a line crosses the y-axis. This is also known as the y-intercept, and the equation is already in slope-intercept form. The b in y = mx + b corresponds to 6 in the equation in the question, and this is also the b in the point (0, b). Another approach to answer this question is to plug the given point into the equation. The 0 is the x and the b is the y, so the equation becomes b = ![]() (0) + 6 = 0 + 6 = 6. Either way, the correct answer is (D).
(0) + 6 = 0 + 6 = 6. Either way, the correct answer is (D).
![]()
As we saw in question 19 above, another form of the line equation that may show up on the PSAT 8/9 is the standard form. In this form, Ax + By = C, the slope is — and the y-intercept is
  . Knowing these shortcuts can help you avoid having to convert a line in standard form to the slope-intercept form.
The distance formula looks quite complicated. The easiest way to solve the distance between two points is to connect them and form a triangle. Then use the Pythagorean Theorem. Many times, the triangle formed is one of the common Pythagorean triplets (3-4-5 or 5-12-13).
The midpoint formula gives the midpoint of a line segment on the coordinate plane. For example, the line ST has points S (x2, y2) and T (x2, y2). To find the midpoint of this line segment, simply find the average of the x-coordinates and the y-coordinates. In our example, the midpoint would be  .
.
To find the point of intersection of two lines, find a way to set them equal and solve for the variable. If the equations are already in y = mx + b form, set the mx + b part of the two equations equal and solve for x. If the question asks for the value of y, plug the value of x back into either equation to solve for y. It may also be possible to Plug In the Answers (see Chapter 11 for more on this) or graph the equations on your calculator. These skills will also help find the points of intersection between a line and a non-linear graph such as a parabola.
Sometimes, it’s a little trickier. Let’s look at a difficult question that combines several of the previous concepts.
![]()
Questions 10—12 refer to the following information.
Two construction workers are digging holes using shovels and measuring their dig rates to determine who is faster. Both construction workers start in holes below ground level at their assigned dig sites and dig vertically down through the dirt.
The depth below ground level d, in meters (m), that construction worker Elijah has reached in terms of time t, in minutes, after he started digging is described by the function d(t) = 1.8t + 4.5.
Construction worker Betty begins in a hole below ground level. Betty’s depth below ground level, in m, for the first 5 minutes of digging is described in the table below. Betty’s dig rate is constant throughout the competition.
Time (min) |
Depth below |
0 |
6.5 |
1 |
8.7 |
2 |
10.9 |
3 |
13.1 |
4 |
15.3 |
5 |
17.5 |
Where’s question 10?
On the PSAT 8/9, you will often see a set of questions based on shared information. You’ll see this content again with question 10 in the next chapter.
11.How long will it take Betty, in minutes, to reach a depth of approximately 19.7 meters below ground level?
A)5
B)6
C)7
D)8
Here’s How to Crack It
The question asks for the time in minutes that it will take Betty to dig 19.7 meters below ground. When dealing with sets of questions, it is important to take the time to find the right information. The chart gives data about Betty. You might be tempted to find the slope and the equation of the line for Betty’s progress, but start by ballparking. Based on the chart, Betty is only 17.5 meters below ground at 5 minutes, so the correct answer cannot be 5. The depth of 19.7 meters is not too far below a depth of 17.5 meters, so it is unlikely to take her 3 more minutes to get there, making (D) less probable. Use the numbers on the chart to determine how far Betty digs in one minute. From minute 4 to minute 5, she dug from 15.3 m to 17.5 m, which is 2.2 meters. From minute 5 to minute 6, she’ll dig an additional 2.2 meters to reach a depth of 17.5 + 2.2 = 19.7 meters. This is the depth the question asked about, so the correct answer is (B).
Now let’s look at one that does require finding the slope.
12.Zeb begins to dig in an additional hole at the same time as Elijah. Zeb’s depth below ground level, in m, for the first 5 minutes of digging is described in the table below. If Zeb digs at a constant rate, how many minutes will it take Zeb and Elijah to be at the same depth below ground level?
Time (min) |
Depth below |
0 |
6.0 |
1 |
7.7 |
2 |
9.4 |
3 |
11.1 |
4 |
12.8 |
5 |
14.5 |
A) 1.7
B) 4.5
C)10
D)15
Here’s How to Crack It
The question asks for the number of seconds it will take for two workers to dig to the same depth. For Elijah, there is an equation to model his depth: d(t) = 1.8t + 4.5. If you had an equation for Zeb’s depth, you could set the two equations equal and solve for t. To create that equation, start by using two points on the chart to calculate the slope. Two such points for (t, d(t)) are (1, 7.7) and (2, 9.4). The slope can be found with the expression 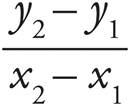 , which becomes
 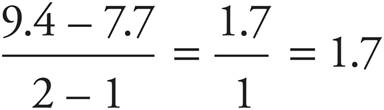 . The y-intercept is the point at which x (or in this case t) is 0, so that value of y (or in this case d(t)) is 6.0. Therefore, the equation for Zeb becomes d(t) = 1.7t + 6.0. Since we want to know when the depth of the holes are the same, set the equations equal to each other to get 1.8t + 4.5 = 1.7t + 6.0. Subtract 1.7t from both sides of the equation to get 0.1t + 4.5 = 6.0. Subtract 4.5 from both sides to get 0.1t = 1.5, then divide both sides by 0.1 to get t = 15. The correct answer is (D).
![]()
Math Basics Drill 3
Answers can be found in Part IV.
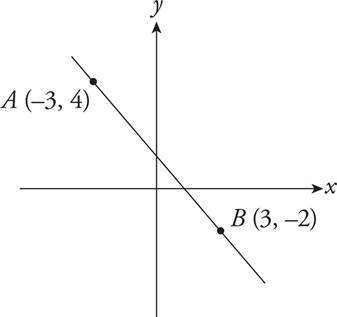
a. How many units do you count up (rise) to get from point B to point A?
b. How many units must you count over (run) to get from point A to point B?
c. What is the slope of the line above?
(Remember, the line is going down to the right, so it must have a negative slope.)
d. What would be the slope of a line parallel to AB?
e. What would be the slope of a line perpendicular to AB?
f. What is the distance from point A to point B?
g. What is the midpoint of line segment AB?
y = x2 + 8x + 23
4.What is the value of the y-intercept for the above equation when graphed in the xy-plane?
A) —8
B) 0
C) 8
D) 23
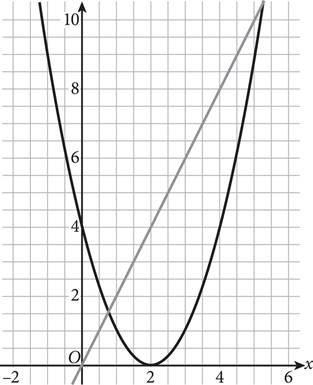
9.A system of equations is graphed in the xy-plane above. How many solutions does the system have?
A)None
B)One
C)Two
D)Three
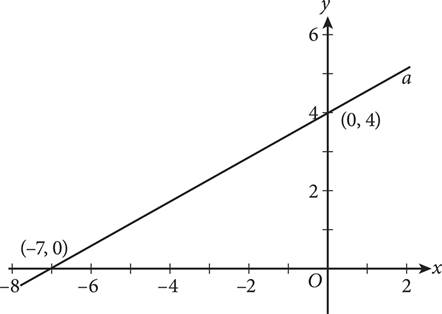
6.Line a is shown in the xy-plane above. Assuming line b lies parallel to line a, which of the following equations could represent line b?
A)y = — x — 2
x — 2
B)y = — x + 4
x + 4
C)y = — x + 3
x + 3
D)y = — x — 6
x — 6
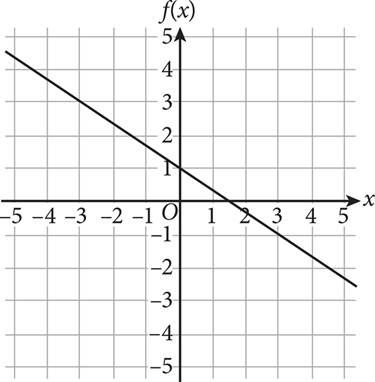

9.A line that contains the point ( , 0) is graphed in the xy-plane above. Which of the following equations represents the line?
A)f(x) = —3x + 2
B)f(x) = — x — 2
x — 2
C)f(x) = —2x + 3
D)f(x) = — x + 1
x + 1
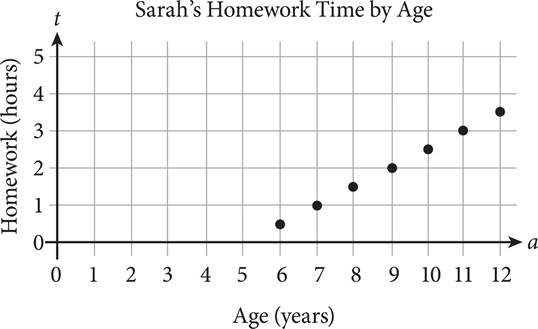
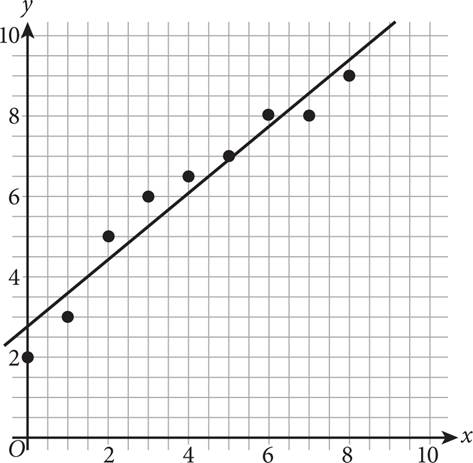
17.Sarah’s parents tracked the amount of time she spent on homework as she grew up. The scatterplot above shows how the amount of time t, in hours, Sarah spent on homework in relation to her age a, in years. Which of the following equations best models this data, where 6 ≤ a ≤ 12?
A)t = —0.5a — 2.5
B)t = —2.5a — 0.5
C)t = 0.5a — 2.5
D)t = 2.5a — 0.5
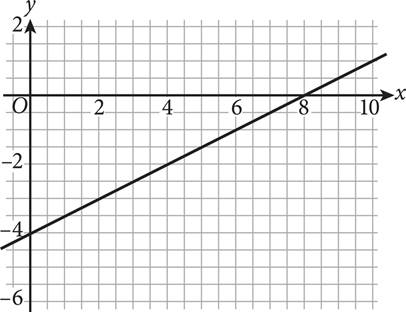
19.The xy-plane above shows a graph of the line y = tx — r, where t and r are constants. What is the value of r?
A)—8
B)—4
C) 4
D) 8
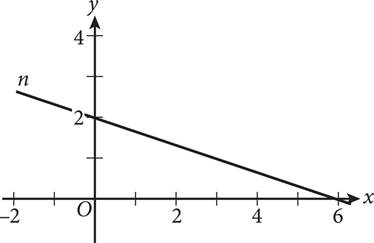
20.If the graph of line n in the xy-plane above is represented by the equation y = mx + c, where m and c are constants, which of the following set of inequalities is true about m and c?
A) 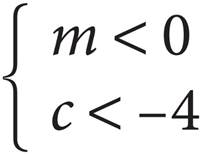
B) 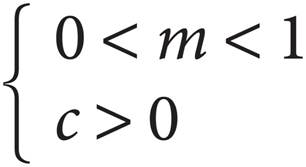
C) 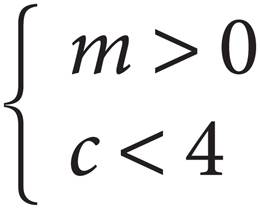
D) 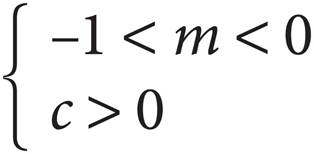
CHARTS AND GRAPHS
Another basic math skill you will need for the PSAT 8/9 is the ability to read charts and graphs. The PSAT 8/9 includes charts, graphs, and tables throughout the test (not just in the Math sections) to present data for students to analyze. The test-writers believe this better reflects what students learn in school and need to understand in the real world. The situations will typically include real-life applications, such as finance and business situations, social science issues, and science.
Since you’ll be seeing graphics throughout the test, let’s look at the types you may encounter and the skills you’ll need to be familiar with when you work with charts and graphs.
The Scatterplot
A scatterplot is a graph with distinct data points, each representing one piece of information. On the scatterplot below, each dot represents the number of televisions sold at a certain price point.
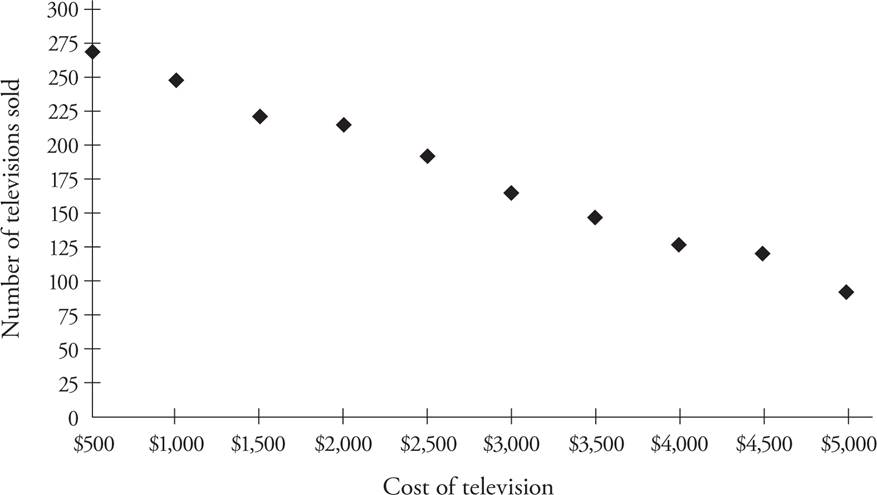
Here’s How to Read It
To find the cost of a television when 225 televisions are sold, start at 225 on the vertical axis and draw a horizontal line to the right until you hit a data point. Use the edge of your answer sheet as a straightedge if you have trouble drawing your own straight lines. Once you hit a point, draw a straight line down from it to the horizontal axis and read the number the line hits, which should be $1,500. To determine the number of televisions sold when they cost a certain amount, reverse the steps—start at the bottom, draw up until you hit a point, and then move left until you intersect the vertical axis.
A question may ask you to draw a “line of best fit” on a scatterplot diagram. This is the line that best represents the data. You can use the edge of your answer sheet as a ruler to help you draw a line that goes through most of the data.
The Line Graph
A line graph is similar to a scatterplot in that it shows different data points that relate the two variables. The difference with a line graph, though, is that the points have been connected to create a continuous line.
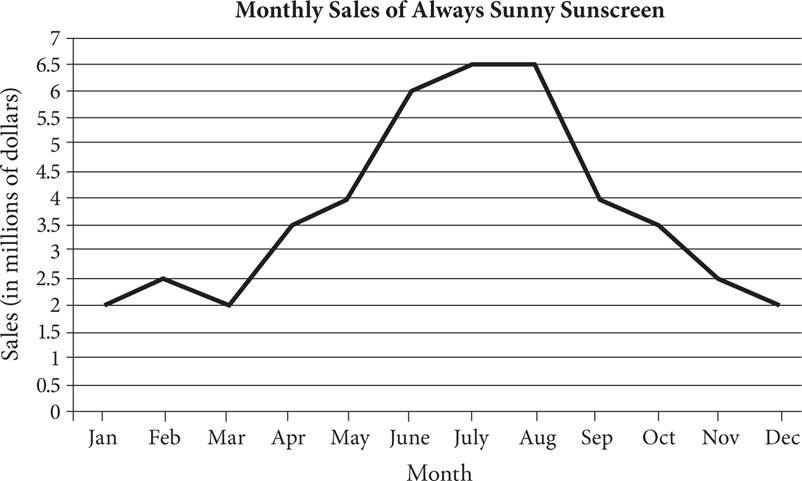
Here’s How to Read It
Reading a line graph is very similar to reading a scatterplot. Start at the axis that represents the data given, and draw a straight line up or to the right until you intersect the graph line. Then move left or down until you hit the other axis. For example, in February, indicated by an F on the horizontal axis, Always Sunny Sunscreen had 2.5 million in sales. Make sure to notice the units on each axis. If February sales were only $2.50, rather than $2.5 million, then this company wouldn’t be doing very well!
The Bar Graph (or Histogram)
Instead of showing a variety of different data points, a bar graph will show how many items belong to a particular category. If the variable at the bottom is given in ranges, instead of distinct items, the graph is called a histogram, but you read it the same way.
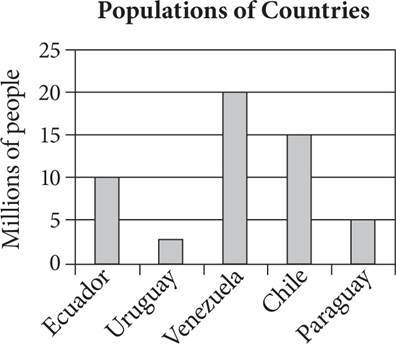
Here’s How to Read It
The height of each bar corresponds to a value on the vertical axis. In this case, the bar above Chile hits the line that intersects with 15 on the vertical axis, so there are 15 million people in Chile. Again, watch the units to make sure you know what the numbers on the axes represent. On this graph, horizontal lines are drawn at 5-unit intervals, making the graph easier to read. If these lines do not appear on a bar graph, use your answer sheet to determine the height of a given bar.
The Two-Way Table
A two-way table is another way to represent data without actually graphing it. Instead of having the variables represented on the vertical and horizontal axes, the data will be arranged in rows and columns. The top row will give the headings for each column, and the left-most column will give the headings for each row. The numbers in each box indicate the data for the category represented by the row and the column the box is in.
|
Computer Production |
||
Morning Shift |
Afternoon Shift |
|
Monday |
200 |
375 |
Tuesday |
245 |
330 |
Wednesday |
255 |
340 |
Thursday |
250 |
315 |
Friday |
225 |
360 |
Here’s How to Read It
If you wanted to see the number of computers produced on Tuesday morning, you could start in the Morning Shift column and look down until you found the number in the row that says “Tuesday,” or you could start in the row for Tuesday and look to the right until you found the Morning Shift column. Either way, the result is 245. Some tables will give you totals in the bottom row and/or the right-most column, but sometimes you will need to find the totals yourself by adding up all the numbers in each row or in each column. More complicated tables will have more categories listed in rows and/or columns, or the tables may even contain extraneous information.
THE BOX PLOT
A box plot shows data broken into quartiles, as follows:
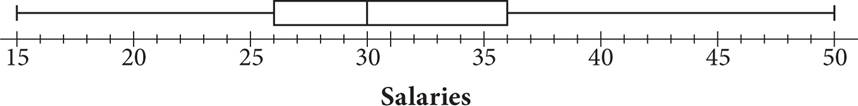
Here’s How to Read It
Here is what all the parts of the box plot represent.
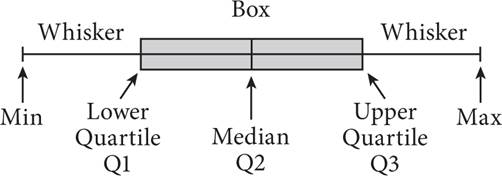
The line in the middle of the box shows the median value of the data, which is 30 in the example above. The “whiskers,” which give this figure the alternate name “box-and-whisker plot,” represent the highest value on the list with the end of the whisker on the right and the lowest value with the end of the whisker on the left. Thus, the minimum value of this data set is 15, and the maximum is 50. Then the data between the median and these minimum and maximum values is broken into two equal parts on each side, creating four “quartiles.” The value halfway between the minimum and the median is the Q1 value on the left side of the box, at about 26, and the value halfway between the maximum and the median is the Q3 value on the right side of the box, at about 36.
The Stem-and-Leaf Plot
A stem-and-leaf plot shows data according to a common first digit.
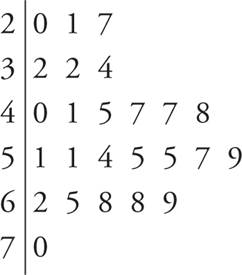
A book club took a survey of the age, in years, of its members. The data is shown in the stem-and-leaf plot above.
Here’s How to Read It
The numbers on the left of the vertical line are the initial digit of each age, and the numbers to the left of the vertical line are the following digits corresponding to the given first digit. This means that the ages of the members of the book club are 20, 21, 27, 32, 32, 34, etc. Questions using stem-and-leaf plots often ask for things like the range of the data, the median of the data, or the probability of selecting a certain number. We will look at all those statistical measures in the Math Techniques chapter.
From a stem-and-leaf plot or a box plot, you can determine the median and range of the set of data. It is also possible to calculate the mode and mean from a stem-and-leaf plot and the interquartile range from a box plot.
Figure Facts
Every time you encounter a figure or graphic on the PSAT 8/9, you should make sure you understand how to read it by checking the following things:
· What are the variables for each axis or the headings for the table?
· What units are used for each variable?
· Are there any key pieces of information (numbers, for example) in the legend of the chart that you should note?
· What type of relationship is shown by the data in the chart? For instance, if the chart includes curves that show an upward slope, then the graph shows a positive association, while curves that show a downward slope show a negative association.
· You can use the edge of your answer sheet as a ruler to help you make sure you are locating the correct data in the graph or to draw a line of best fit if necessary.
GRIDS-INS: THE BASICS
You will see 7 questions on the PSAT 8/9 that ask you to bubble in a numerical answer on a grid, rather than answer a multiple-choice question. These Grid-In questions are arranged in a loose order of difficulty, meaning they start easier and get progressively harder, and can be solved according to the methods outlined for the multiple-choice problems on the test. Don’t worry that there are no answer choices—your approach is the same.
Keep Left
No matter how many digits in your answers, always start gridding in the leftmost column. That way, you’ll avoid omitting digits and losing points.
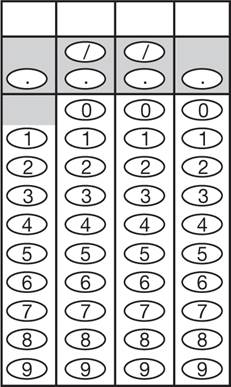
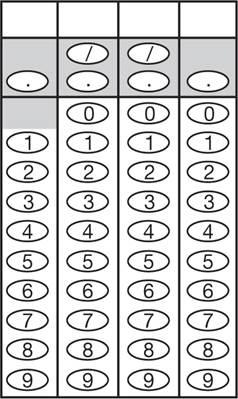
The only difficulty with Grid-In questions is getting used to the way in which you are asked to answer the question. For each question, you’ll have a grid like the following:
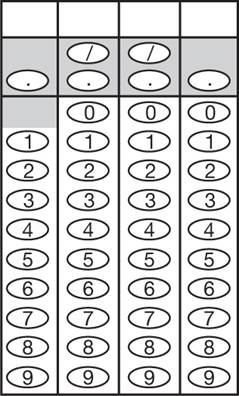
We recommend that you write the answer on top of the grid to help you bubble, but it’s important to know that the scoring machine reads only the bubbles. If you bubble incorrectly, the computer will consider the answer to be incorrect.
Here are the basic rules of gridding:
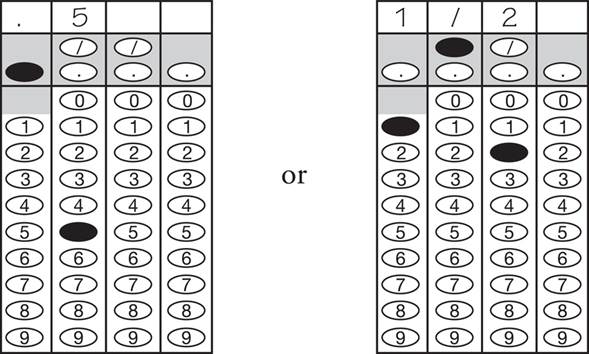
1.If your answer uses fewer than four boxes, you can grid it anywhere you like. To avoid confusion, we suggest that you start at the leftmost box. For example,
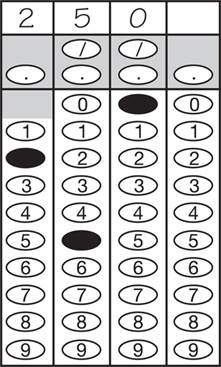
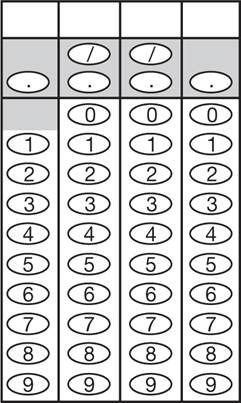
2.You can grid your answer as either a fraction or a decimal, if the fraction will fit. You can grid and answer of .5 as either .5 or ![]() .
.
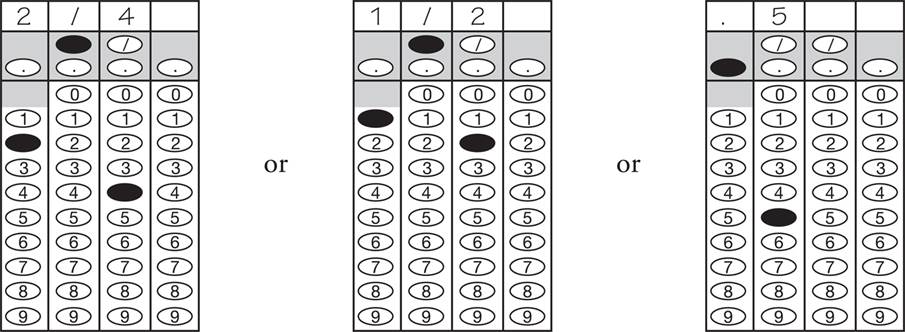
3.You do not need to reduce your fractions, if the fraction will fit. If your answer is ![]() , you can grid it as
, you can grid it as ![]() ,
, ![]() , or 0.5.
, or 0.5.
Relax
If your answer is a fraction and it fits in the grid (fraction bar included), don’t reduce it. Why bother? You won’t get an extra point for doing so. However, if your fraction doesn’t fit, reduce it or turn it into a decimal on your calculator.
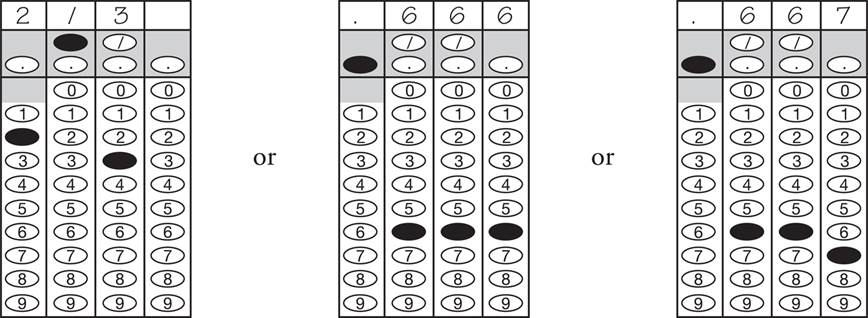
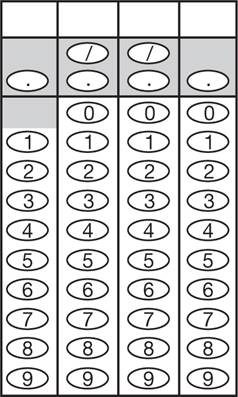
4.If you have a decimal that will not fit in the spaces provided, you must grid as many places as will fit.
If your answer is ![]() , you can grid it as
, you can grid it as ![]() , .666, or .667, but .66 or 0.66 are not acceptable.
, .666, or .667, but .66 or 0.66 are not acceptable.
You do not need to round your numbers, so we suggest that you don’t. There’s no reason to give yourself a chance to make a mistake if you don’t have to.
5.You cannot grid mixed numbers. Convert all mixed numbers to ordinary fractions. If your answer is 2![]() , you must convert it to
, you must convert it to ![]() or 2.5; otherwise the computer will read your 2 1/2 as 21/2.
or 2.5; otherwise the computer will read your 2 1/2 as 21/2.
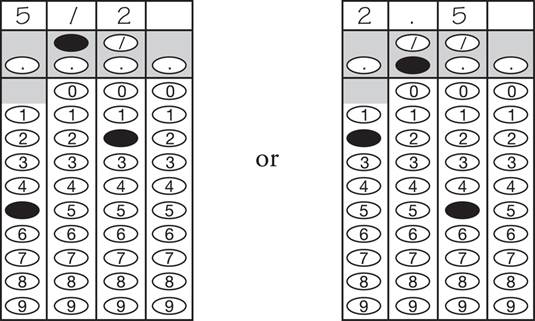
Don’t Mix
Never grid in a mixed number. Change it into an improper fraction or decimal. To convert mixed fraction into improper fractions, all you have to do is multiply the denominator with the whole number in from of the fraction, then add that product to the numerator, and finally put that number over the denominator you started with.
6.You can’t grid π, square roots, variables, or negative numbers, so if you get an answer with one of those terms, you’ve made a mistake. Reread the final question and check your work.
Math Basics Drill 4
Answers can be found in Part IV.
11.The function f(x) = —3x — 2 is graphed in the xy-plane. Line b is perpendicular to function f. What is the slope of line b?
12.What value of g satisfies the equation —8(g — 3) = —2g + 6?
13.If 5x2 = 125, what could be the value of 5x?
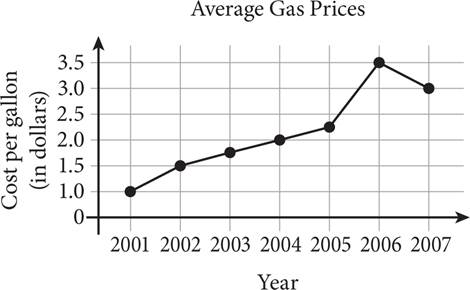
3.The average cost of a gallon of gas from 2000 to 2007 is displayed in the line graph above. How much more did a gallon of gas cost in 2007 than in 2003, according to the line graph?
A)$1.00
B)$1.25
C)$1.75
D)$3.00
![]()
Questions 14 and 15 refer to the following information.
John was interested in the effect caffeine had on his reading speed and graphed the relationship between caffeine intake, in milligrams per hour, and his reading speed, in pages per hour, in the scatterplot below.
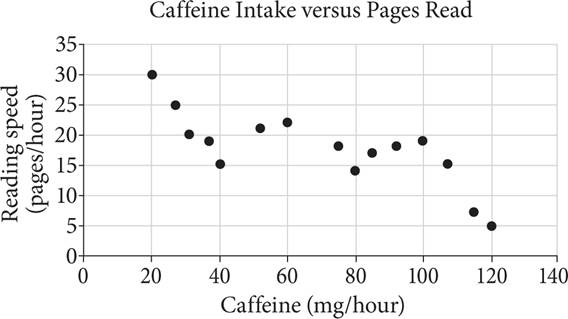
14.Based on the data John collected, over which of the following intervals is there a positive relationship between his caffeine intake, in milligrams per hour, and his reading speed, in pages per hour?
A)40—60 and 60—75
B)40—60 and 80—100
C)25—40 and 40—60
D)25—40, 60—80, and 100—120
15.John wants to estimate what his reading speed would be, in pages per hour, if he were to consume 45 mg of caffeine in an hour. Using the trend that he observed between 40 and 60 milligrams per hour, which of the following is closest to the reading speed, in pages per hour, that John can expect?
A)13
B)15
C)17
D)20
![]()
16.A data set showing the relationship between two variables is graphed in the xy-plane to produce the scatterplot below. A line of best fit is generated and is shown on the graph.
How much greater is the y-value of the data point at x = 4 than the y-value of the best fit line at the same x-value?
A)12.5
B) 6.5
C) 6.0
D) 0.5
23.Charlie uses apple juice and cherry juice to make a punch for his birthday party. The expression 1.9a + 2.2c = 13.9 models the recipe Charlie uses to make the punch, where a and c are the volumes, in liters, of apple juice and cherry juice, respectively. How many liters of cherry juice does Charlie need for the recipe if he uses 5 liters of apple juice?
Summary
o The Math sections are arranged in a loose Order of Difficulty, which can make it easier to spot the less difficult problems. However, remember that the test-writers’ idea of “easier” problems is not necessarily the same as your idea. Let your Personal Order of Difficulty be your guide.
o Write in your test booklet to set up problems, and then use your calculator (when allowed) to figure out solutions. And remember to type carefully—your calculator won’t check for mistakes.
o Review basic definitions again before the test to make sure you don’t get stuck on the “little words.”
o To solve equations for a variable, isolate the variable. Make sure you perform the same operations on both sides of the equation.
o Inequalities can be worked just like equations, until you have to multiply or divide by a negative number. Then you need to flip the inequality sign.
o To solve simultaneous equations, simply add or subtract the equations. If you don’t have the answer, look for multiples of your solutions. When the simultaneous equation question asks for a single variable and addition and subtraction don’t work, try to make something disappear. Multiply the equations by a constant to make the coefficient(s) of the variable(s) you want go to zero when the equations are added or subtracted.
o When writing a system of equations, start with the most straightforward piece of information.
o You can also use the equations in the answer choices to help you narrow down the possibilities for your equations. Eliminate any answers in which an equation doesn’t match your equation.
o Parallel lines have the same slope and no solutions. If two lines have the same slope and infinitely many solutions, they are actually the same line. Perpendicular lines have slopes that are negative reciprocals of one another.
o Rather than worrying about the distance formula, connect the two points and make the resulting line the hypotenuse of a right triangle. Then you can use the Pythagorean Theorem to find the distance.
o The coordinates of the midpoint of a line segment with endpoints (x1, y1) and (x2, y2) will be 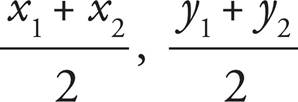 .
.
o When you encounter charts, carefully check the chart for information you should note, and remember that you can use your answer sheet as a ruler to help you locate information or to draw a line of best fit.
o When doing Grid-In questions, be sure to keep to the left, and don’t bother reducing fractions if they fit in the allotted spaces.