PSAT/NMSQT Prep 2019 - Princeton Review 2019
The Kaplan Method for math & linear equations
Heart of algebra
Math
CHAPTER OBJECTIVES
By the end of this chapter, you will be able to:
1. Apply the Kaplan Method for Math to Heart of Algebra questions
2. Recognize, simplify, and solve linear equations efficiently
3. Translate complex word problems into equations
4. Interpret the most commonly tested types of linear graphs
SMARTPOINTS
|
Point Value |
SmartPoint Category |
|
Point Builder |
Kaplan Method for Math |
|
110 Points |
Linear Equations |
Prepare
THE KAPLAN METHOD FOR MATH
Because the PSAT is a standardized test, students who approach each question in a consistent way will be rewarded on Test Day. Applying the same basic steps to every math question—whether it asks you about geometry, algebra, or even trigonometry—will help you avoid minor mistakes as well as tempting incorrect answer choices.
Use the Kaplan Method for Math for every math question on the PSAT. Its steps are applicable to every situation and reflect the best test-taking practices.
The Kaplan Method for Math has three steps:
1. Step 1: Read the question, identifying and organizing important information as you go
2. Step 2: Choose the best strategy to answer the question
3. Step 3: Check that you answered the right question
Let’s examine each of these steps in more detail.
Step 1: Read the question, identifying and organizing important information as you go
This means asking yourself the following questions.
· What information am I given? Take a few seconds to jot down the information you are given and try to group similar items together.
· What is the question asking? Separate the question from the context. Word problems may include information that is unnecessary to solve the question. Feel free to discard any unnecessary information.
· How are the answer choices different? Reading answer choices carefully can help you spot the most efficient way to solve a multiple-choice math question. For example, if the answer choices in a question on the calculator section are decimals, then painstakingly rewriting your final answer as a simplified fraction is a waste of time; you can just use your calculator instead.
· Should I label or draw a diagram? If the question describes a shape or figure but doesn’t provide one, sketch a diagram so you can see the shape or figure and add notes to it. If a figure is provided, take a few seconds to label it with information from the question.
Expert Tip
Don’t assume you understand a question as soon as you see it. Many students see an equation and immediately begin solving. Solving math questions without carefully reading can take you down the wrong path on Test Day.
Step 2: Choose the best strategy to answer the question
· Look for patterns. Every PSAT math question can be solved in a variety of ways, but not all strategies are created equally. To finish all of the questions, you’ll need to solve questions as efficiently as possible. If you find yourself about to do time-consuming math, take a moment to look for time-saving shortcuts.
· Pick numbers or use straightforward math. While you can always solve a PSAT math question with what you’ve learned in school, doing so won’t always be the fastest way. On questions that describe relationships between numbers (such as percentages) but don’t actually use numbers, you can often save time on Test Day by using techniques such as Picking Numbers instead of straightforward math.
Expert Tip
The PSAT won’t give you any extra points for solving a question the hard way.
Step 3: Check that you answered the right question
· When you get the final answer, resist the urge to immediately bubble in the answer. Take a moment to do the following:
o Review the question stem
o Check units of measurement
o Double-check your work
· The PSAT will often ask you for quantities such as x + 1 or the product of x and y. Be careful on these questions! They often include tempting answer choices that correspond to the values of x or y individually. There’s no partial credit on the PSAT, so take a moment at the end of every question to make sure you’re answering the right question.
LINEAR EQUATIONS
Linear equations and linear graphs are some of the most common elements on the PSAT Math Test. They can be used to model relationships and changes such as those concerning time, temperature, or population.
The graphs of these equations are as important as the equations themselves. The graphs you will see most are either linear or lines of best fit. A sample graph is shown:
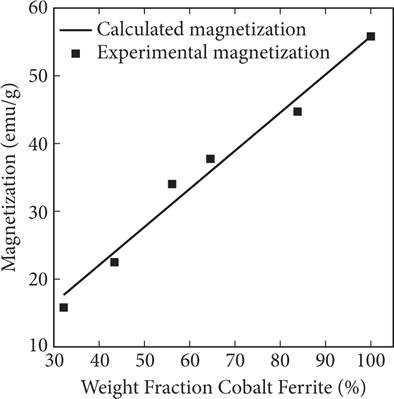
When working with a graph like this, you may not know anything about magnetization or cobalt ferrite, but you do see a graph with a straight line on it. That straight line is your clue that you’re dealing with a linear equation.
Being able to work with, understand, and interpret linear equations will make up a substantial part of your Math score. In this chapter, we will explore all of those scenarios so you’ll be ready to tackle linear equations in whatever form you encounter them on the test.
Many students inadvertently switch on “math autopilot” when solving linear equations, automatically running through the same set of steps on every equation without looking for the best way to solve the question. On the PSAT, however, every second counts. You will want to use the most efficient strategy for solving questions. To see this in action, take a look at the following example:
1. ![]() (3x + 17) =
(3x + 17) = ![]() (8x — 10)
(8x — 10)
Which value of x satisfies the equation above?
1. −61
2. −55
3. −41
4. −35
The following table shows Kaplan’s strategic thinking on the left, along with suggested math scratchwork on the right. Keeping your notes organized is critical for success on the PSAT, so start practicing now setting up well-organized scratchwork.
|
Strategic Thinking |
Math Scratchwork |
|
Step 1: Read the question, identifying and organizing important information as you go This question is straightforward: you’re being asked to solve the equation and find the correct value of x. |
|
|
Step 2: Choose the best strategy to answer the question Should you distribute those fractions first, or is there a faster way to solve? By multiplying both sides of the equation by 6, you make the equation much simpler. Finish by using the distributive property, collecting like terms, and solving for x. |
6 × [ 3(3x + 17) = 8x - 10 9x + 51 = 8x - 10 x = -61 |
|
Step 3: Check that you answered the right question You found the value of x, and it matches (A). |
|
You could have approached a question like this in many ways, but remember, the goal is to get the correct answer quickly. The faster you solve algebraic equations, the more time you’ll be able to devote to challenging questions, setting you up to earn more points on Test Day.
Remember
As you practice, always ask yourself: “Is there a faster way to solve this question?” Use the Answers & Explanations at the back of this book to check!
When solving an equation, always keep in mind the fundamental principles of equality: because both sides of an equation are equal, you need to do the same thing to both sides so that equality is preserved. Try solving another linear equation for extra practice:
2. —2(x — 3) = 17
What value of x satisfies the equation shown?
1. ![]()
2. —10
3. —7
4. ![]()
Work through the Kaplan Method for Math step-by-step to solve this question. The following table shows Kaplan’s strategic thinking on the left, along with suggested math scratchwork on the right.
|
Strategic Thinking |
Math Scratchwork |
|
Step 1: Read the question, identifying and organizing important information as you go This looks similar to the first question. It’s asking you to solve the equation and find the correct value of x. |
—2(x — 3) = 17 |
|
Step 2: Choose the best strategy to answer the question What’s the fastest way to solve this? It doesn’t look like there are many options. Use principles of equality and do the same thing to both sides until x is by itself. First, carefully distribute the —2. Next, subtract 6 from both sides and divide by —2. |
—2x + 6 = 17 —2x = 11 x = — |
|
Step 3: Check that you answered the right question As requested, you’ve solved for x. Choice (D) is correct. |
x = — |
Notice that some of the answer choices are notintegers. The PSAT may challenge you by designing questions so that the answer is in a form you do not expect. If you arrive at an answer in an unusual form, don’t be alarmed. Fractions and decimals are often correct on the PSAT.
Looking carefully at how the PSAT uses fractions and decimals can guide your strategy in solving linear equations. The presence of fractions in the answer choices likely means you’ll need to rely on techniques for combining and simplifying fractions to get to the correct answer. Seeing decimals in the answer choices, on the other hand, likely indicates that you can rely on your calculator and save time on Test Day.
Try to determine the best strategy for solving the next question.
3. 
Which approximate value of x satisfies the equation shown?
1. 4.29
2. 4.65
3. 6.6
4. 6.8
Work through the Kaplan Method for Math step-by-step to solve this question. The following table shows Kaplan’s strategic thinking on the left, along with suggested math scratchwork on the right.
|
Strategic Thinking |
Math Scratchwork |
|
Step 1: Read the question, identifying and organizing important information as you go Notice a pattern? Again, the question is asking you to solve for x. |
|
|
Step 2: Choose the best strategy to answer the question How can you quickly solve this problem? Clearing the fraction outside the parentheses is a smart move. Multiply both sides by 7. What do you notice about the answer choices? How are they different from the answers in the last question? The presence of decimals means your calculator will be a great asset here. Don’t worry about common denominators. Divide the fractions. Because the answer choices are only written to two decimal places, write your intermediate steps to two places as well. Now distribute the numbers outside the parentheses, collect like terms, and solve for x. |
8(x - 0.46) + 28(x + 0.89) = 266 8x - 3.68 + 28x + 24.92 = 266 36x = 244.76 x = 6.8 |
|
Step 3: Check that you answered the right question Double-check the question stem. Choice (D) is correct. |
x = 6.8 |
Notice in the previous question that careful use of your calculator can eliminate the need to complete time-consuming tasks by hand. Be conscious of the format of the answer choices—decimal answers are a great clue that you can use your calculator.
Note
Many graphing calculators have a built-in function that will let you input and solve algebraic equations like the previous one. Consider learning how to use it before Test Day by reading the instruction manual or searching online.
LINEAR WORD PROBLEMS (REAL-WORLD SCENARIOS)
Another way linear equations can be made to look complicated is for them to be disguised in real-world word problems, where it’s up to you to extract and solve an equation. When you’re answering these questions, you may run into trouble translating English into math. The following table shows some of the most common phrases and mathematical equivalents you’re likely to see on the PSAT.
|
Word Problems Translation Table |
|
|
English |
Math |
|
equals, is, equivalent to, was, will be, has, costs, adds up to, the same as, as much as |
= |
|
times, of, multiplied by, product of, twice, double, by |
× |
|
divided by, per, out of, each, ratio |
÷ |
|
plus, added to, and, sum, combined, total, increased by |
+ |
|
minus, subtracted from, smaller than, less than, fewer, decreased by, difference between |
— |
|
a number, how much, how many, what |
x, n, etc. |
Linear word problems are made more difficult by complex phrasing and extraneous information. Don’t get frustrated—word problems can be broken down in predictable ways. To stay organized on Test Day, use the Kaplan Strategy for Translating English into Math:
· Define any variables, choosing letters that make sense
· Break sentences into short phrases
· Translate each phrase into a mathematical expression
· Put the expressions together to form an equation
Let’s apply this to a straightforward example: Colin’s age is three less than twice Jim’s age.
· Define any variables, choosing letters that make sense: We’ll choose C for Colin’s age and J for Jim’s age.
· Break sentences into short phrases: The information about Colin and the information about Jim seem like separate phrases.
· Translate each phrase into a mathematical expression: Colin’s age = C; 3 less than twice Jim’s age = 2J — 3.
· Put the expressions together to form an equation: Combine the results to get C = 2J — 3.
This strategy fits into the larger framework of the Kaplan Method for Math. When you get to Step 2: Choose the best strategy to answer the question and are trying to solve a word problem as efficiently as possible, switch over to this strategy to move forward quickly.
The Kaplan Strategy for Translating English into Math works every time. Apply it here to a test-like example:
4. The number k can be determined in the following way: multiply m by 2, add 3n to the result, and subtract (4m − 5n) from this sum. What is the value of k in terms of m and n ?
1. −2m − 3n
2. −2m + 2n
3. −2m + 8n
4. 6m − 2n
Work through the Kaplan Method for Math step-by-step to solve this question. The following table shows Kaplan’s strategic thinking on the left, along with suggested math scratchwork on the right.
|
Strategic Thinking |
Math Scratchwork |
|
Step 1: Read the question, identifying and organizing important information as you go The question is asking you to solve for k in terms of m and n. You’re looking for what comes after k = . |
|
|
Step 2: Choose the best strategy to answer the question Where should you start? Go through each component of the Kaplan Strategy for Translating English into Math. Do you need to choose variables? No, the variables are already defined for you. How can you logically break down this question? Phrases about k and phrases about m and n are reasonable choices. Go ahead and translate: “k can be determined” “Multiply m by 2, add 3n to the result” “Subtract (4m − 5n)” Combine the results. This doesn’t look like an exact match for any of the answer choices. Can you simplify? Distribute the negative and combine like terms. |
- (4m - 5n) k = 2m + 3n - (4m - 5n) k = 2m + 3n - 4m + 5n |
|
Step 3: Check that you answered the right question Perfect! Now you have an exact match for (C). |
k = -2m + 8n |
LINEAR GRAPHS
Working with equations algebraically is only half the battle. The PSAT will also expect you to work with graphs of linear equations, which means using lines in slope-intercept form and point-slope form.
One of the most important quantities you’ll be working with when graphing a linear equation is the slope. Slope is given by the following equation: ![]() , where (x1, y1) and (x2, y2) are coordinates of points on the line. To remember this, think:
, where (x1, y1) and (x2, y2) are coordinates of points on the line. To remember this, think: ![]() .
.
One of the most common forms of a linear equation is slope-intercept form, which is used to describe the graph of a straight line. The formula is quickly recognizable: y = mx + b. The variables y and x represent the coordinates of a point on the graph through which the line passes, while m tells us what the slope of the line is and b represents the point at which the line intersects the y-axis.
Remember: a line with a positive slope runs up and to the right (“uphill”), and a line with a negative slope runs down and to the right (“downhill”). In the following figure, lines n and l have positive and negative slopes, respectively:
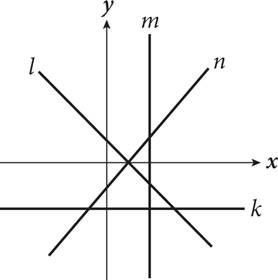
Occasionally, you will encounter a line with a slope of 0—meaning it does not rise or fall from left to right. These lines are easy to spot because they are horizontal and are parallel to the x-axis (line k in the figure shown). Lines that are parallel to the y-axis, such as line m in the figure, have slopes that are “undefined.” The lines themselves exist, but their slopes cannot be calculated numerically.
The slope of a graph can also tell you valuable information about the rate of change of numbers and variables associated with the line. A positive slope signifies an increase in a variable, while a negative slope indicates a decrease. Large numerical values for slope indicate rapid changes, while small numerical values point to more gradual changes. Imagine that the balance in your checking account is B and that it changes with the number of days that go by, D. Think about how each of the following models would impact your life:

The first equation probably looks pretty good. The second equation isn’t as great. An extra quarter a day isn’t going to do much for you. The third equation would quickly drive you into bankruptcy, while the fourth equation might be cause for concern after a while.
The y-intercept, on the other hand, is often less significant, typically representing the initial condition in a model—that is, where the model begins. In the checking account example, the beginning balance was $75 in all four models. Notice, the y-intercept didn’t change at all.
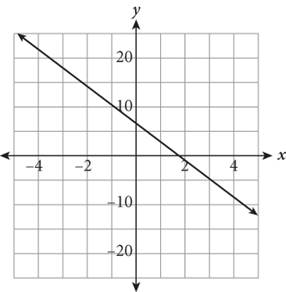
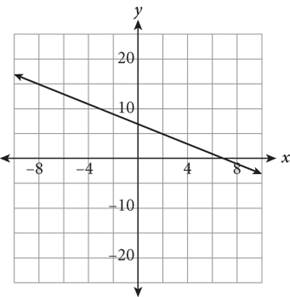
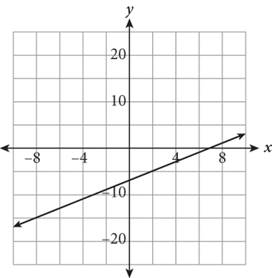
Look at the following question to see how the PSAT might test your ability to match a linear equation with its graph:
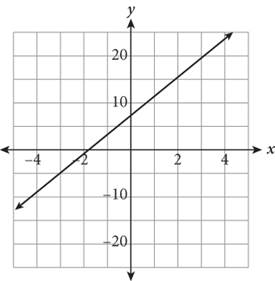
5. Which of the following shows the graph of the line y = 4x + 7 ?
1. 
2. 
3. 
4. 
Approach this question by using the Kaplan Method for Math. Because there isn’t any scratchwork required for a question like this, only the column containing Kaplan’s strategic thinking is included in the following table. Try to ask yourself similar questions as you work through questions like this on Test Day.
|
Strategic Thinking |
|
Step 1: Read the question, identifying and organizing important information as you go This question is asking you to match the linear equation to the appropriate graph. |
|
Step 2: Choose the best strategy to answer the question What is the fastest way to solve this? Should you use your graphing calculator, or can you eliminate some answer choices quickly? Notice that the graphs are vastly different. You’re looking for a graph that slopes up and to the right (positive slope) and has a y-intercept of +7. Only one of the graphs matches those criteria. |
|
Step 3: Check that you answered the right question Only (A) has a graph with a positive slope and a positive y-intercept. |
Some questions are a little more challenging. They’re usually similar in structure to the “checking account” equation described earlier, but they can involve more complicated scenarios. This next question requires you to choose the best model for a given real-world situation. See if you can match the graph to an appropriate model. Watch out: it’s a science “crossover” question, so you’ll need to be particularly careful to separate the question from the context.
6. 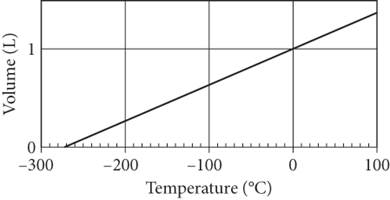
Jacques Charles was a French scientist who discovered the relationship between the temperature and volume of a gas. Specifically, Charles found that gases expand when heated. This relationship was formalized in Charles’s Law, which illustrates a linear relationship between temperature and volume in gases. The graph here shows the volume of a sample of gas as it is cooled. If T is the temperature of the gas in °C and V is the volume in liters, which of the following equations, when plotted, could produce the graph shown?
1. V = 0.004T + 100
2. V = 0.004T
3. V = 0.004T + 1
4. V = 0.004T − 0.25
Although you may enjoy learning about history with your math, you don’t need to waste time digesting extraneous information. The following table shows the strategic thinking that can help you solve this question. No scratchwork is necessary.
|
Strategic Thinking |
|
Step 1: Read the question, identifying and organizing important information as you go Only the last two sentences describe the graph. They are underlined here: Jacques Charles was a French scientist who discovered the relationship between the temperature and volume of a gas. Specifically, Charles found that gases expand when heated. This relationship was formalized in Charles’s Law, which illustrates a linear relationship between temperature and volume in gases. The graph here shows the volume of a sample of gas as it is cooled. If T is the temperature of the gas in °C and V is the volume in liters, which of the following equations, when plotted, could produce the graph shown? Match the graph to the equation. Because V is on the y-axis and T is on the x-axis, the standard y = mx + b equation should resemble V = mT + b. All you need to do now is figure out the slope and y-intercept. |
|
Step 2: Choose the best strategy to answer the question Should you graph each of the lines in the answer choices on your calculator? Is that the most efficient use of time? Probably not. Notice that the answer choices describe very different lines. What part is different in each answer choice? Each option has a different y-intercept. To answer this complicated question, all you need to do is find the y-intercept of the graph and match it to an answer choice. Where is the y-axis in the graph? Notice the unusual orientation of the graph. The y-axis will always be at x = 0, but it does not have to be located at the far left of the graph. In this graph, the y-axis is offset and is located in the middle of the right side of the graph. In this case, the line intersects the y-axis at the point (0, 1). Therefore, you know you’re looking for a line that has a y-intercept of 1. |
|
Step 3: Check that you answered the right question You can safely eliminate every answer choice except (C), the correct answer. |
While scatterplots will be described in more detail in subsequent chapters, this next question shows that the principles covered here for graphing linear equations can be equally applied to the line of best fit on a scatterplot. See what you can conclude from the slope and y-intercept of the equation of the line of best fit. Note that this question is an example of a very complex word problem—don’t be intimidated! If you can tackle this question, you’ll be able to handle the most difficult PSAT word problems.
7. 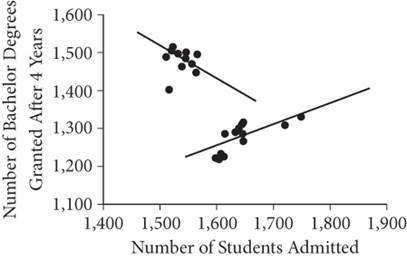
A university admissions department compiled data on students over a 25-year period. The department wanted to know how many students admitted in a given year graduated four years later with a degree. It noted that the number of students admitted showed a regular and consistent increase over the 25-year period. These data are plotted in the graph shown. Halfway through the data collection period, the general college enacted a policy that would allow students to take a year-long break during their studies. The college wants to model the relationship between the number of students admitted and the number of degrees attained in four years with a line of best fit before and after the policy change. Which of the following describes the best estimate for m, the slope of this line, before the change and after the change?
1. Before: m = −1; after: m = 0
2. Before: m = 1; after: m = ![]()
3. Before: m = −1; after: m = ![]()
4. Before: m = ![]() ; after: m = 0
; after: m = 0
Use the Kaplan Method for Math to make short work of this question. The following table shows the strategic thinking that can help you solve complex questions like this one.
|
Strategic Thinking |
|
Step 1: Read the question, identifying and organizing important information as you go In this case, the question is asking you to find the slope before and after the policy change. Because the number of students admitted increased over time, you know that data before the policy change are on the left side of the graph and data after the policy change are on the right side. |
|
Step 2: Choose the best strategy to answer the question How can you solve this efficiently? Do you notice any differences between the answer choices that would result in vastly different slopes? Do the signs tell you anything? Because the line of best fit for the data collected before the policy change slopes down and to the right, you’re looking for a negative slope. That eliminates choices B and D. Because the line of best fit for the data collected after the policy change slopes up and to the right, you know you need a positive slope. That eliminates A. |
|
Step 3: Check that you answered the right question Because only one answer choice remains that describes the slopes of both lines correctly, you can confidently choose (C) without worrying about the numbers here. |
Notice that even complicated-looking questions involving linear graphs often boil down to the same basic concepts of slope and y-intercept. Master those ideas and you’ll be able to handle any linear graph you’ll see on the PSAT.
Practice
Now you’ll have a chance to try a few more test-like questions. Use the scaffolding as needed to guide you through the question and get the correct answer.
Some guidance is provided, but you’ll need to fill in the missing parts of explanations or the step-by-step math to get to the correct answer. Don’t worry—after going through the examples at the beginning of this chapter, these questions should be completely doable. If you find yourself struggling, however, review the worked examples again.
8. Ms. Walser’s class had 18 students. She used three equally weighted tests to determine their final grades. The class average for the first test was 92, and the class average for the second test was 77. If the overall class average was 84, what was the average score for the third test?
1. 74.3
2. 77
3. 83
4. 84.3
The following table can help you structure your thinking as you work your way through this question. Kaplan’s strategic thinking is provided, as are bits of structured scratchwork. If you’re not sure how to approach a question like this, start at the top and work your way down.
|
Strategic Thinking |
Math Scratchwork |
|
Step 1: Read the question, identifying and organizing important information as you go You’re solving for the average score on the third test. The number of students is extraneous information. Because the tests are equally weighted, just divide by 3 to calculate the final average. |
|
|
Step 2: Choose the best strategy to answer the question Use the Kaplan Strategy for Translating English into Math to get through this word problem quickly. Can you give the variables names that make sense? Careful, T would give you trouble with Test Two and Test Three. Could you start at the beginning of the alphabet? How can you logically break this question apart into shorter sentences? Is it possible to translate each phrase into a math expression? Because you don’t have a score for the third test, what should you do? Leave it as a variable? Almost there. Can you put all the pieces together? How can you use the average of the three scores to solve for the third test score? Remember that the average is equal to the sum of the terms divided by the number of terms. Test Three should remain a variable because it is the quantity being solved for. After you’ve plugged everything in, can you rearrange the equation to get the score on Test Three? |
Average on Test One = _____ Average on Test Two = _____ Average on Test Three = _____ Overall Average = _____ On Test One, the class scored an average of ____. On Test ____the class scored an average of 77. The class’s __________ average was 84. ______ = 92 ______ = 77 ______ = 84 (___+___+___)/3=___ |
|
Step 3: Check that you answered the right question Check your work. Does the variable you solved for correspond to the score on Test Three? |
____ = ____ |
Here’s another test-like example to try:
9. A box of candies contains only chocolates, licorice sticks, peppermints, and gummy bears. If ![]() of the candies are chocolates,
of the candies are chocolates, ![]() of the candies are gummy bears,
of the candies are gummy bears, ![]() are peppermints, and 9 are licorice sticks, what is the product of the number of peppermints and the number of chocolates?
are peppermints, and 9 are licorice sticks, what is the product of the number of peppermints and the number of chocolates?
1. 12
2. 36
3. 72
4. 108
The following table can help you structure your thinking as you work your way through this question. Kaplan’s strategic thinking is provided, as are bits of structured scratchwork. If you’re not sure how to approach a question like this, start at the top and work your way down.
|
Strategic Thinking |
Math Scratchwork |
|
Step 1: Read the question, identifying and organizing important information as you go You need to find the product of peppermints and chocolates. |
|
|
Step 2: Choose the best strategy to answer the question How can you effectively translate this English into math? Use the Kaplan Strategy for Translating English into Math. Can you think of a variable to correspond to the total number of candies in the box? Be careful! Because chocolates, gummy bears, and peppermints are all defined in terms of the total number of candies, do they need their own variables? How can each candy be written as a fraction of b? Break the question down into shorter phrases and translate into math. Almost there. What should all of these candies add up to? Think about what variable they’re all a fraction of. At this point, solve for the number of candies in the box. |
Total Candies = ______
9 = ______
b = ____ |
|
Step 3: Check that you answered the right question Careful! Don’t bubble in what you just solved for! You’re looking for the product of chocolates and peppermints. Now multiply these candies together to get the final answer, (D). |
chocolates = peppermints = __ b = _____ product = ______ |
Perform
Now that you’ve seen the variety of ways in which the PSAT can test you on linear equations, try the following three questions to check your understanding. Give yourself 3.5 minutes to answer the questions. Make sure you use the Kaplan Method for Math on every question. Remember, you’ll need to emphasize speed and efficiency in addition to simply getting the correct answer.
10.Ibrahim has a contract for a cell phone plan that includes the following rates: the plan has a fixed cost of $50 a month, a data plan that provides 2 GB of data for free and $8 for each GB of data after that, and a text message plan that costs $0.10 per text message sent. Which of the following equations represents the amount of money in dollars that Ibrahim will spend as long as he uses at least 2 GB of data? (Assume d = dollars, g = number of GB of data used, and t = number of text messages sent.)
1. d = 50 + 8g + 0.1t
2. d = 50 + (8g — 2) + 0.1t
3. d = 50 + 8(g — 2) + 0.1t
4. d = 5,000 + 800g + 10t
11.If ![]() , then what does
, then what does ![]() equal?
equal?
12.A certain gym sells two membership packages. The first package, the Die-Hard Package, costs $250 for 6 months of unlimited use. The second package, the Personal Package, costs $130 initially plus $4 each day the member visits. How many visits would a person need to use for each package to cost the same amount over a 6-month period?
1. 2
2. 30
3. 96
4. 120
On your own
The calculator icon means you are permitted to use a calculator to solve a question. It does not mean that you should use it, however.
1. A municipality charges two types of local taxes: a per capita tax, which is a flat fee that every person pays, and a local income tax, which is a percentage of the person’s annual income, i. If a taxpayer’s total tax bill is given by the function T = 0.02i + 25, then the value 0.02 best represents which of the following?
1. The per capita tax
2. The taxpayer’s annual income
3. The total tax bill minus the per capita tax
4. The amount of the income tax as a percentage
2. ![]()
In the equation shown, what is the value of n ?
1. ![]()
2. ![]()
3. ![]()
4. ![]()
3. If 36 + 3(4x − 9) = c(2x + 1) + 25 has no solution and c is a constant, what is the value of c ?
1. −3
2. 3
3. 6
4. 12
4. Jenna is renting a car while on a business trip. The cost is $54.95 per day, which is taxed at a rate of 6%. The car rental company charges an additional one-time, untaxed environmental impact fee of $10. Which of the following equations represents Jenna’s total cost, in dollars, for renting the car for d days?
1. c = (54.95 + 0.06d) + 10
2. c = 1.06(54.95d) + 10
3. c = 1.06(54.95d + 10)
4. c = 1.06(54.95 + 10)d
5.
|
Price of One Can |
Projected Number of Cans Sold |
|
$0.75 |
10,000 |
|
$0.80 |
9,000 |
|
$0.85 |
8,000 |
|
$0.90 |
7,000 |
|
$0.95 |
6,000 |
|
$1.00 |
5,000 |
6. Which of the following equations best describes the relationship shown in the table, where n indicates the number of cans sold and p represents the price in dollars of one can?
1. n = −20,000p + 25,000
2. n = −200p + 250
3. n = 200p + 250
4. n = 20,000p + 25,000
6. 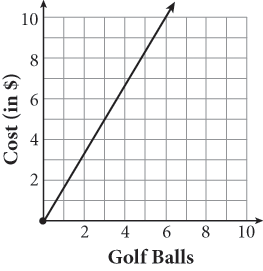
A driving range sells golf balls in different quantities. The figure shows the costs of the various quantities. According to the figure, what is the cost of a single golf ball?
1. $0.60
2. $1.67
3. $3.00
4. $5.00
7. Juan is on his school’s archery team. In a match, he gets 12 arrows to shoot at a target. He gets 8 points if the arrow hits the inner circle of the target and 4 points if it hits the outer circle. Which of the following equations represents Juan’s total score if a of his arrows hit the inner circle and the rest hit the outer circle?
1. p = 8a
2. p = 8a + 4
3. p = 48 + 4a
4. p = 96 − 4a
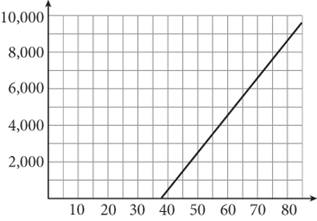
8. 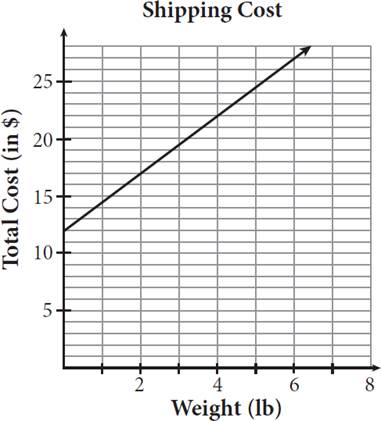
A freight company charges a flat insurance fee to deliver a package anywhere in the continental United States, plus an additional charge for each pound the package weighs. The graph shows the relationship between the weight of the package and the total cost to ship it. Based on the graph, how much would it cost to ship a 25-pound box?
1. $37.00
2. $48.00
3. $62.50
4. $74.50
9. Which value of x makes the equation ![]() true?
true?
1. 7
2. 9
3. 17
4. 19
10.Sandy works at a tire store. She gets paid $70 for a day’s work, plus a commission of $14 for each tire she sells. Which of the following equations represents the relationship between one day of Sandy’s pay, y, and the number of tires she sells, x ?
1. x = 14y + 70
2. x = 70y + 14
3. y = 14x + 70
4. y = 70x + 14
11.The value of a new car starts to depreciate as soon as it’s purchased and driven for the first time. If the equation y = −0.15x + 27,000 represents the estimated value of a certain car, taking into account depreciation over time, what does 27,000 most likely represent?
1. The depreciation rate
2. The current value of the car
3. The purchase price of the car
4. The value of the car after 0.15 years of ownership
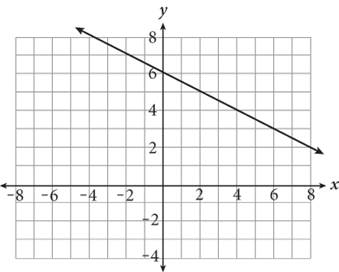
12.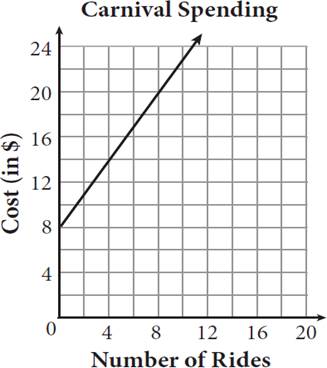
The figure shows the cost of going to a certain carnival. What does the y-intercept most likely represent?
1. A flat entrance fee
2. The cost of riding 8 rides
3. The cost of attending the carnival 8 times
4. The total cost of attending the carnival and riding 1 ride
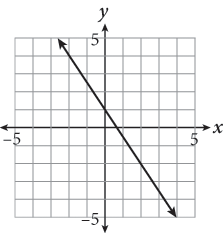
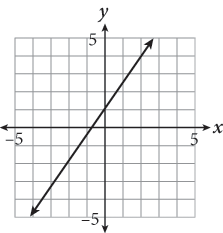
13.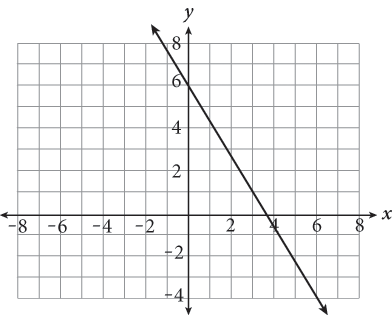
What is the slope of the line shown in the figure?
1. ![]()
2. ![]()
3. ![]()
4. ![]()
14.Which of the following does not represent a linear relationship?
1. y = x
2. ![]()
3. 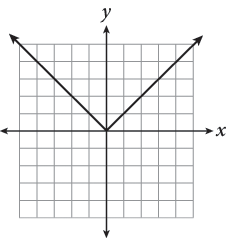
4.
|
x |
y |
|
-1 |
8 |
|
1 |
4 |
|
3 |
0 |
|
5 |
-4 |
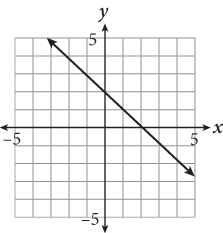
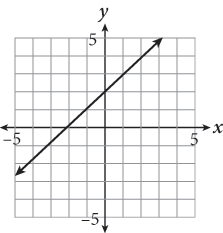
15.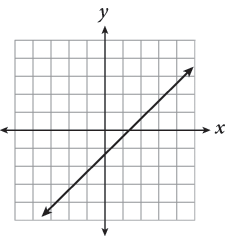
If the equation of the line shown in the figure is written in the form y = mx + b, which of the following is true?
1. m < 0 and b < 0
2. m < 0 and b > 0
3. m > 0 and b < 0
4. m > 0 and b > 0
16.
The figure shown represents which of the following equations?
1. ![]()
2. ![]()
3. ![]()
4. ![]()
17.![]()
What is the value of h in the equation above?
1. h = −5.5
2. h = 5.5
3. There is no value of h for which the equation is true.
4. There are infinitely many values of h for which the equation is true.
18.A produce stand normally sells watermelons for $0.60 per pound. On Mondays, it sells watermelons at a 20% discount. The stand also sells sweet potatoes for $0.79 each. Which of the following represents the total cost, c, if a customer buys 4 sweet potatoes and a watermelon weighing p pounds on a Monday?
1. c = 0.2p + 0.79
2. c = 0.48p + 3.16
3. c = 0.6p + 0.79
4. c = 0.6p + 3.16
19.A company is hosting a business conference at a hotel. The hotel charges a flat rental rate for the use of the room plus a per person rate for the food service. If the equation used to calculate the total cost of the conference is y = 15x + 325, then which of the following most likely represents the number of people attending?
1. x
2. y
3. 15
4. 325
20.A machine running around the clock can produce 3,600 bolts per day. Based on this information, what could the equation y = 150x represent?
1. The number of bolts the machine can produce in x days
2. The number of bolts the machine can produce in x hours
3. The number of days it takes the machine to produce x bolts
4. The number of hours it takes the machine to produce x bolts
21.The graph of which of the following linear equations has a slope of 0 ?
1. x = 0
2. y = 2
3. x = y
4. x − y = 2
22.
Which of the following scenarios could be supported by the graph shown?
1. As the temperature in a room decreases, the number of bacteria decreases.
2. As the temperature in a room decreases, the number of bacteria increases.
3. As the temperature in a room increases, the number of bacteria decreases.
4. As the temperature in a room increases, the number of bacteria remains constant.
23.Which of the following figures could be the graph of the equation ax + by = c, given that a > 0, b > 0, and c = b ?
1. 
2. 
3. 
4. 
24.Malik drew a linear graph that is increasing and has a negative x-intercept. Which of the following could be the equation Malik graphed?
1. 4x + 3y = 1
2. −x + 2y = −8
3. 2x + 3y = −9
4. 3x − 5y = −10
25.When graphing a linear equation that is written in the form y = mx + b, the variable m represents the slope of the line, and b represents the y-intercept. Which of the following best describes how reversing the signs of m and b would affect the graph of this line?
1. The graph will be a perfect reflection of the original line across the x-axis.
2. The graph will be a perfect reflection of the original line across the y-axis.
3. The new line will slant in the opposite direction, and the x-intercept will be reflected across the x-axis.
4. The new line will slant in the opposite direction, and the y-intercept will be reflected across the y-axis.
26.For which of the following is it possible to have both a positive value of x and a negative value of x that satisfy the equation?
1. ![]()
2. ![]()
3. ![]()
4. ![]()
27.A machine feeds a food pellet to a mouse once every 2.5 hours. If p is the number of pellets the mouse is fed over the course of d full days, which of the following equations defines p ?
1. ![]()
2. ![]()
3. ![]()
4. ![]()
28.Karla is at the county fair and is playing a game in which she uses a magnet to catch toy fish. If the fish has a purple dot underneath, it is worth 2 points; if it has a green dot underneath, it is worth 5 points. Every fish has either a purple dot or a green dot. To play, it costs 50 cents for each attempt. If Karla catches f fish that have purple dots, the expression 2f + 5(8 − f) represents the total number of points she earns. Based on this expression, how much in dollars did Karla spend playing the fish game?
1. 2
2. 4
3. 5
4. 8
29.What was the initial amount of water in a barrel, in liters, if there are now x liters, y liters were spilled, and 6 liters were added?
1. x − y + 6
2. y − x + 6
3. x + y + 6
4. y + x − 6
30.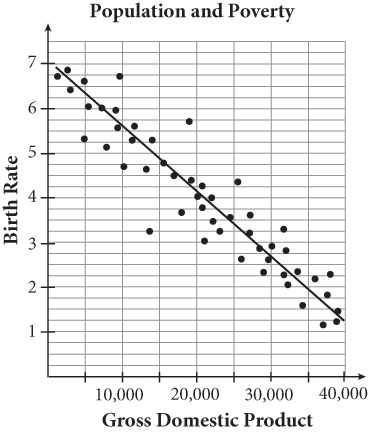
A historian conducted a study of 50 nations regarding the relationship between population and poverty. Specifically, she studied the birth rate, or number of children per woman, and the wealth of the nation measured as gross domestic product. The results are shown in the figure, along with a line of best fit for the data. What does the slope of the line of best fit illustrate about the relationship between birth rate and the wealth of a nation?
1. As the birth rate of a nation increases, the wealth increases.
2. As the birth rate of a nation decreases, the wealth decreases.
3. As the wealth of a nation increases, the birth rate decreases.
4. As the wealth of a nation decreases, the birth rate decreases.
31.![]()
What value of y satisfies the equation above?
32.For what value of y does the graph of ![]() cross the y-axis?
cross the y-axis?