PSAT/NMSQT Prep 2022 - Eggert M.D., Strelka A. 2022
Linear graphs
Linear equations and graphs
The heart of algebra
LEARNING OBJECTIVES
After this lesson, you will be able to:
· Calculate the slope of a line given two points
· Write the equation of a line in slope-intercept form
· Discern whether the slope of a line is positive, negative, zero, or undefined based on its graph
· Describe the slopes of parallel and perpendicular lines
To answer a question like this:
Which of the following equations describes the line that passes through the points (2, −4) and (−2, 2)?
A. ![]()
B. ![]()
C. ![]()
D. ![]()
You need to know this:
The answer choices in this question are written in slope-intercept form: y = mx + b. In this form of a linear equation, m represents the slope of the line and b represents the y-intercept. You can think of the slope of a line as how steep it is. The y-intercept is the point at which the line crosses the y-axis and can be written as the ordered pair (0, y).
You can calculate the slope of a line if you know any two points on the line. The formula is ![]() , where (x1, y1) and (x2, y2) are the coordinates of the two points on the line.
, where (x1, y1) and (x2, y2) are the coordinates of the two points on the line.
A line that moves from the bottom left to the top right has a positive slope. A line that moves from the top left to the bottom right has a negative slope. A horizontal line has a slope of zero and a vertical line has an undefined slope.
Some PSAT questions ask about parallel or perpendicular lines. Parallel lines have the same slope, while perpendicular lines have negative reciprocal slopes.
You need to do this:
· Find the slope of the line.
· Write the equation in slope-intercept form, substituting the value of the slope you found and one of the known points for x and y.
· Solve for the y-intercept.
Explanation:
In the question above, ![]() . Of the answer choices, only (C) and (D) have negative slopes, so rule out (A) and (B).
. Of the answer choices, only (C) and (D) have negative slopes, so rule out (A) and (B).
To find the y-intercept of the line, write the equation for the line in slope-intercept form and plug in one of the known points for x and y:
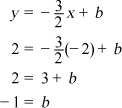
Therefore, (D) is correct.
Another way to solve this question would be to plot the two points, graph the line, check where it crosses the y-axis to find the y-intercept, and count how many spaces the line moves up for each space it moves to the right to find the slope.
Try on Your Own
Directions: Take as much time as you need on these questions. Work carefully and methodically. There will be an opportunity for timed practice at the end of the chapter.
HINT: For Q11, remember that parallel lines have the same slope and perpendicular lines have opposite sign reciprocal slopes.
11. A line, t, is perpendicular to ![]() and passes through the point (3, 5). What is the equation of line t ?
and passes through the point (3, 5). What is the equation of line t ?
A. ![]()
B.![]()
C.![]()
D. ![]()
HINT: Convert the word problem in Q12 to an equation in slope-intercept form, y = mx + b.
Months after June |
4 |
8 |
10 |
Price of Gas |
2 |
3.33 |
4 |
12. ![]() In June, Marie notices that the price of gas is increasing. She records the price of gas 4, 8, and 10 months after her initial observation. If y is the price of gas, in dollars per gallon, and x is the number of months after June, which linear equation represents the correct relationship between y and x ?
In June, Marie notices that the price of gas is increasing. She records the price of gas 4, 8, and 10 months after her initial observation. If y is the price of gas, in dollars per gallon, and x is the number of months after June, which linear equation represents the correct relationship between y and x ?
A. y = 0.33x + 0.67
B.y = 0.67x + 1.33
C.y = 1.33x + 2
D. y = 2.67x + 5.67
HINT: For Q13, focus on where the answer choices differ in their equations: the y-intercept.
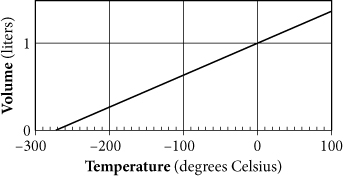
13. The graph above shows the volume of a sample of gas as it is cooled. If T is the temperature of the gas in degrees Celsius and V is the volume in liters, which of the following equations, when plotted, could produce the graph shown?
A. V = 0.004T + 100
B.V = 0.004T
C.V = 0.004T + 1
D. V = 0.004T − 0.25
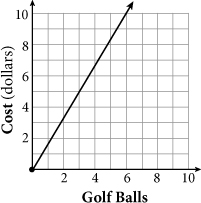
14. ![]() A driving range sells golf balls in different quantities. The figure shows the costs of the various quantities. According to the figure, what is the cost of a single golf ball?
A driving range sells golf balls in different quantities. The figure shows the costs of the various quantities. According to the figure, what is the cost of a single golf ball?
A. $0.60
B.$1.67
C.$3.00
D. $5.00
15. For what value of y does the graph of ![]() cross the y-axis?
cross the y-axis?