PSAT/NMSQT Prep 2022 - Eggert M.D., Strelka A. 2022
Math fundamentals
Prerequisite skills and calculator use
PSAT math
LEARNING OBJECTIVES
After completing this chapter, you will be able to:
· Identify skills necessary to obtain the full benefits of the Math sections of this book
· Use efficiency tips to boost your test-day speed
· Distinguish between questions that need a calculator and questions in which manual calculations are more efficient
Math fundamentals
LEARNING OBJECTIVES
After this lesson, you will be able to:
· Identify skills necessary to obtain the full benefits of the Math sections of this book
· Use efficiency tips to boost your test-day speed
Test Prerequisites
This book focuses on the skills that are tested on the PSAT. It assumes a working knowledge of arithmetic, algebra, and geometry. Before you dive into the subsequent chapters where you’ll try testlike questions, there are a number of concepts—ranging from basic arithmetic to geometry—that you should master. The following sections contain a brief review of these concepts.
Algebra and Arithmetic
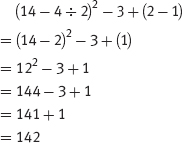
· Order of operations is one of the most fundamental of all arithmetic rules. A well-known mnemonic device for remembering this order is PEMDAS: Please Excuse My Dear Aunt Sally. This translates to Parentheses, Exponents, Multiplication/Division, Addition/Subtraction. Perform multiplication and division from left to right (even if it means division before multiplication) and treat addition and subtraction the same way, as shown here:
· Three basic properties of number (and variable) manipulation—commutative, associative, and distributive—will assist you with algebra on test day:
1. Commutative: Numbers can swap places and still provide the same mathematical result. This is valid only for addition and multiplication. For example:
a + b = b + a → 3 + 4 = 4 + 3
a × b = b × a → 3 × 4 = 4 × 3
BUT: 3 − 4 ≠ 4 − 3 and 3 ÷ 4 ≠ 4 ÷ 3
2. Associative: Different number groupings will provide the same mathematical result. This is valid only for addition and multiplication. For example:
(a + b) + c = a + (b + c) → (4 + 5) + 6 = 4 + (5 + 6)
(a × b) × c = a × (b × c) → (4 × 5) × 6 = 4 × (5 × 6)
BUT: (4 − 5) − 6 ≠ 4 − (5 − 6) and (4 ÷ 5) ÷ 6 ≠ 4 ÷ (5 ÷ 6)
3. Distributive: A number that is multiplied by the sum or difference of two other numbers can be rewritten as the first number multiplied by the two others individually. This does not work with division. For example:
a(b + c) = ab + ac → 6(x + 3) = 6x + 6(3)
a(b − c) = ab − ac →3(y − 2) = 3y + 3(-2)
BUT: 12 ÷ (6 + 2) ≠ 12 ÷ 6 + 12 ÷ 2
Note: When subtracting an expression in parentheses, such as in 4 − (x + 3), distribute the negative sign outside the parentheses first: 4 + (−x − 3) → 1 − x.
· Subtracting a positive number is the same as adding its negative. Likewise, subtracting a negative number is the same as adding its positive:
r − s = r + (−s) → 22 − 15 = 7 and 22 + (−15) = 7
r − (−s) = r + s → 22 − (−15) = 37 and 22 + 15 = 37
· You should be comfortable manipulating both proper and improper fractions.
1. To add and subtract fractions, first find a common denominator, then add the numerators together:
![]()
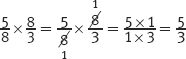
2. Multiplying fractions is straightforward: multiply the numerators together, then repeat for the denominators. Cancel when possible to simplify the answer:
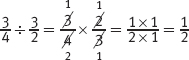
3. Dividing by a fraction is the same as multiplying by its reciprocal. Once you’ve rewritten a division problem as multiplication, follow the rules for fraction multiplication to simplify:
· Absolute value means the distance a number is from 0 on a number line. Because absolute value is a distance, it is always positive or 0. Absolute value can never be negative. For example:
![]()
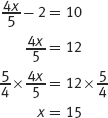
· Whatever you do to one side of an equation, you must do to the other. For instance, if you multiply one side by 3, you must multiply the other side by 3 as well.
· The ability to solve straightforward, one-variable equations is critical on the PSAT. For example:
Note: ![]() is the same as
is the same as ![]() . You could see either form on the PSAT.
. You could see either form on the PSAT.
· You will encounter irrational numbers, such as common radicals and π, on test day. You can carry an irrational number through your calculations as you would a variable ![]() . Only convert to a decimal when you have finished any intermediate steps and when the question asks you to provide an approximate value.
. Only convert to a decimal when you have finished any intermediate steps and when the question asks you to provide an approximate value.
Mental Math
Even if you’re a math whiz, you need to adjust your thought process in terms of the PSAT to give yourself the biggest advantage you can. Knowing a few extra things, such as the below, will boost your speed on test day:
· Don’t abuse your calculator by using it to determine something as simple as 15 ÷ 3 (we’ve seen it many times). Besides, what if you’re in the middle of the no-calculator section? Save time on test day by reviewing multiplication tables. At a bare minimum, work up through the 10s. If you know them through 12 or 15, that’s even better!
· You can save a few seconds of number crunching by memorizing perfect squares. Knowing perfect squares through 10 is a good start; go for 15 or even 20 if you can.
· Percent means “out of a hundred.” For example, ![]() . You can write percents as decimals (e.g., 27% = 0.27).
. You can write percents as decimals (e.g., 27% = 0.27).
· The ability to recognize a few simple fractions masquerading in decimal or percent form will save you time on test day because you won’t have to turn to your calculator to convert them. Memorize the content of the following table.
|
Fraction |
Decimal |
Percent |
|
0.1 |
10% |
|
0.2 |
20% |
|
0.25 |
25% |
|
|
|
|
0.5 |
50% |
|
0.75 |
75% |
Tip: If you don’t have the decimal (or percent) form of a multiple of one of the fractions shown in the table memorized, such as ![]() , just take the fraction with the corresponding denominator (
, just take the fraction with the corresponding denominator (![]() in this case), convert to a decimal (0.2), and multiply by the numerator of the desired fraction to get its decimal equivalent:
in this case), convert to a decimal (0.2), and multiply by the numerator of the desired fraction to get its decimal equivalent:
![]()
Graphing
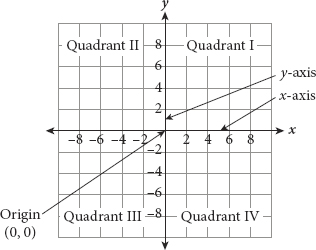
· Basic two-dimensional graphing is performed on a coordinate plane. There are two axes, x and y, that meet at a central point called the origin. Each axis has both positive and negative values that extend outward from the origin at evenly spaced intervals. The axes divide the space into four sections called quadrants, which are labeled I, II, III, and IV. Quadrant I is always the upper-right section, and the rest follow counterclockwise:
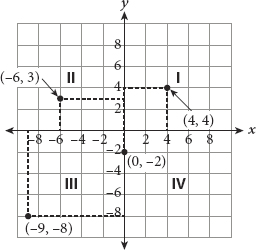
· To plot points on the coordinate plane, you need their coordinates. The x-coordinate is where the point falls along the x-axis, and the y-coordinate is where the point falls along the y-axis. The two coordinates together make an ordered pair written as (x, y). When writing ordered pairs, the x-coordinate is always listed first (think alphabetical order). Four points are plotted in the following figure as examples:
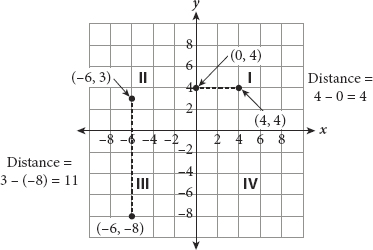
· When two points are vertically or horizontally aligned, calculating the distance between them is easy. For a horizontal distance, only the x-value changes; for a vertical distance, only the y-value changes. Take the positive difference of the x-coordinates (or y-coordinates) to determine the distance—that is, subtract the smaller number from the larger number so that the difference is positive. Two examples are presented here:
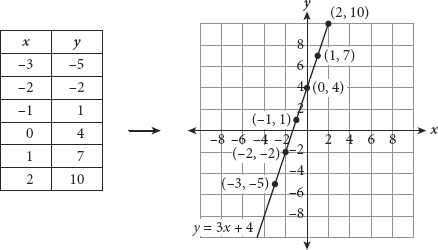
· Two-variable equations have an independent variable (input) and a dependent variable (output). The dependent variable (often y), depends on the independent variable (often x). For example, in the equation y = 3x + 4, x is the independent variable; any y-value depends on what you plug in for x. You can construct a table of values for the equation, which can then be plotted. For example:
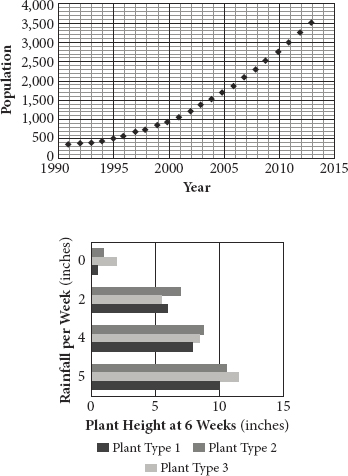
· You may be asked to infer relationships from graphs. In the first of the following graphs, the two variables are time and population. Clearly, the year does not depend on how many people live in the town; rather, the population increases over time and thus depends on the year. In the second graph, you can infer that plant height depends on the amount of rain; thus, rainfall is the independent variable. Note that the independent variable for the second graph is the vertical axis; this can happen with certain nonstandard graphs. On the standard coordinate plane, however, the independent variable is always plotted on the horizontal axis.
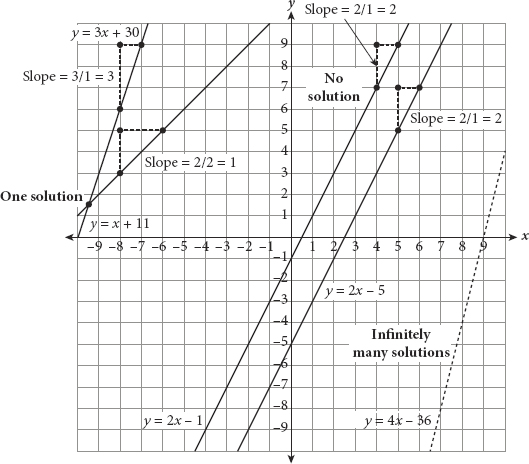
· When two straight lines are graphed simultaneously, one of three possible scenarios will occur:
1. The lines will not intersect at all (no solution).
2. The lines will intersect at one point (one solution).
3. The lines will lie on top of each other (infinitely many solutions).
Geometry
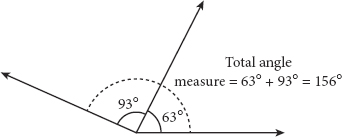
· Adjacent angles can be added to find the measure of a larger angle. The following diagram demonstrates this:
· Two angles that sum to 90° are called complementary angles. Two angles that sum to 180° are called supplementary angles.
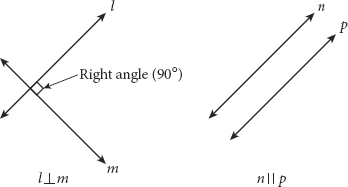
· Two distinct lines in a plane will either intersect at one point or extend indefinitely without intersecting. If two lines intersect at a right angle (90°), they are perpendicular and are denoted with ⊥. If the lines never intersect, they are parallel and are denoted with ||. For example:
· Perimeter and area are basic properties that all two-dimensional shapes have. The perimeter of a polygon can easily be calculated by adding the lengths of all its sides. Area is the amount of two-dimensional space a shape occupies. The most common shapes for which you’ll need these two properties on test day are triangles, parallelograms, and circles.
· The area ( A) of a triangle is given by ![]() , where b is the base of the triangle and h is its height.
, where b is the base of the triangle and h is its height.
The base and height are always perpendicular. Any side of a triangle can be used as the base; just make sure you use its corresponding height (a line segment perpendicular to the base, terminating in the opposite vertex). You can use a right triangle’s two legs as the base and height, but in non-right triangles, if the height is not given, you’ll need to draw it in (from the vertex of the angle opposite the base down to the base itself at a right angle) and compute it.
· The interior angles of a triangle sum to 180°. If you know any two interior angles, you can calculate the third.
· Parallelograms are quadrilaterals with two pairs of parallel sides. Rectangles and squares are subsets of parallelograms. You can find the area of a parallelogram using A = bh. As with triangles, you can use any side of a parallelogram as the base, and again, the height is perpendicular to the base. For a rectangle or square, use the side perpendicular to the base as the height. For any other parallelogram, the height (or enough information to find it) will be given.
· A circle’s perimeter is known as its circumference (C) and is found using C = 2πr, where r is the radius (distance from the center of the circle to its edge). The area of a circle is given by A = πr2. The strange symbol is the lowercase Greek letter pi (π, pronounced “pie”), which is approximately 3.14. As mentioned in the algebra section, you should carry π throughout your calculations without rounding unless instructed otherwise.
· A tangent line touches a circle at exactly one point and is perpendicular to a circle’s radius at the point of contact, as shown here:
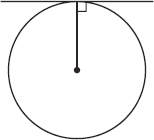
The presence of a right angle opens up the opportunity to draw otherwise hidden shapes, so pay special attention to tangents when they’re mentioned.
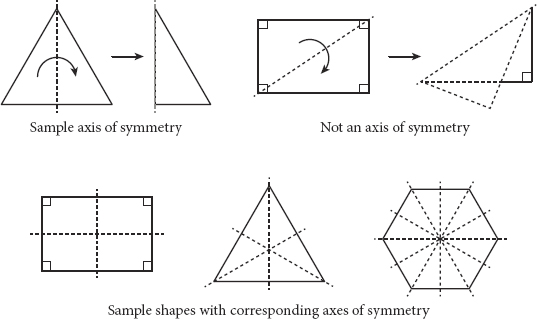
· A shape is said to have symmetry when it can be split by a line (called an axis of symmetry) into two identical parts. Consider folding a shape along a line: if all sides and vertices align once the shape is folded in half, the shape is symmetrical about that line. Some shapes have no axis of symmetry, some have one, some have multiple axes, and still others can have infinite axes of symmetry (e.g., a circle):
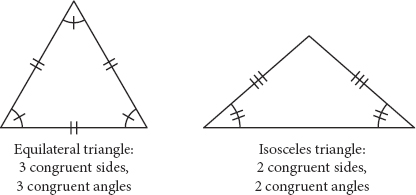
· Congruence is simply a geometry term that means identical. Angles, lines, and shapes can be congruent. Congruence is indicated by using hash marks. Everything with the same number of hash marks is congruent:
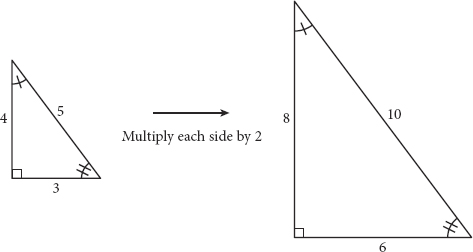
· Similarity between shapes indicates that they have identical angles and proportional sides. Think of taking a shape and stretching or shrinking each side by the same ratio. The resulting shape will have the same angles as the original. While the sides will not be identical, they will be proportional. For example:
If you’re comfortable with these concepts, read on for tips on calculator use. If not, review this lesson and remember to refer to it for help if you get stuck in a later chapter.