PSAT/NMSQT Prep 2022 - Eggert M.D., Strelka A. 2022
Statistics
Tables, statistics, and probability
Data analysis
LEARNING OBJECTIVES
After this lesson, you will be able to:
· Calculate mean, median, mode, and range
· Define standard deviation and margin of error
To answer a question like this:
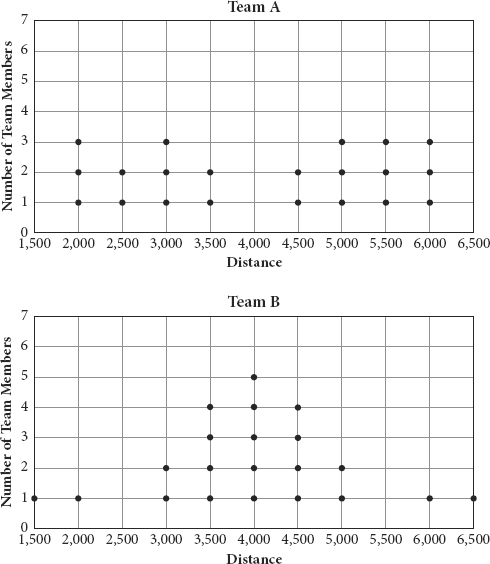
Two different schools record how many meters their running teams can run. Each school has 21 members on its team, and the distances in meters run by each member are recorded above. If MA and SA are the median and standard deviation, respectively, of team A, and MB and SB are the median and standard deviation, respectively, of team B, then which of the following statements is true?
A. MA < MB and SA < SB
B. MA > MB and SA < SB
C. MA > MB and SA > SB
D. MA < MB and SA > SB
You need to know this:
Suppose a nurse took a patient’s pulse at different times of day and found it to be 75, 78, 71, 71, and 68. Here are six fundamental statistics figures you can determine for this data set:
· Mean (also called arithmetic mean or average): The sum of the values divided by the number of values. For this data set, the mean pulse is ![]()
· Median: The value that is in the middle of the set when the values are arranged in ascending order. The pulse values in ascending order are 68, 71, 71, 75, and 78. The middle term is the third term, making the median 71. (If the list consists of an even number of values, the median is the average of the middle two values.)
· Mode: The value that occurs most frequently. The value that appears more than any other is 71, which appears twice (while all other numbers appear only once), so it is the mode. If more than one value appears the most often, that’s okay; a set of data can have multiple modes. For example, if the nurse took the patient’s pulse a sixth time and it was 68, then both 71 and 68 would be modes for this data set.
· Range: The difference between the highest and lowest values. In this data set, the lowest and highest values are 68 and 78, respectively, so the range is 78 − 68 = 10.
· Standard deviation: A measure of how far a typical data point is from the mean. A low standard deviation means most values in the set are fairly close to the mean; a high standard deviation means there is much more spread in the data set. On the PSAT, you will need to know what standard deviation is and what it tells you about a set of data, but you won’t have to calculate it.
· Margin of error: A description of the maximum expected difference between a true statistics measure (e.g., the mean or median) for a data pool and that same statistics measure for a random sample from the data pool. A lower margin of error is achieved by increasing the size of the random sample. As with standard deviation, you will need to know what a margin of error is on the PSAT, but you won’t be asked to calculate one.
You need to do this:
· To compare two standard deviations, look at how spread out the data set is. The more clustered the data, the lower the standard deviation.
· To find the median, arrange all values in order. In a dot plot or frequency distribution table, that means finding the group with the middle value.
Explanation:
Start with the standard deviation. The scores in team B are more clustered around the mean, so the standard deviation for team B will be smaller than that for team A, where the scores are more spread out. Eliminate (A) and (B).
To calculate the medians of the two classes, you need to find the middle value in each data set. Each class has 21 students, so the middle score will be the 11th term. Count from the left of each dot plot to find that the 11th score for team A is 4,500 and for team B is 4,000. So the median for team B is smaller, which makes (C) correct.
Try on Your Own
Directions: Take as much time as you need on these questions. Work carefully and methodically. There will be an opportunity for timed practice at the end of the chapter.
HINT: For Q7, think about what standard deviation means.
|
Huiping |
Deanna |
Katya |
|
Dive 1 |
8.2 |
9.0 |
7.7 |
Dive 2 |
7.3 |
7.1 |
8.4 |
Dive 3 |
8.6 |
6.5 |
7.5 |
Dive 4 |
8.0 |
8.6 |
8.1 |
Dive 5 |
9.1 |
6.1 |
8.1 |
Dive 6 |
8.4 |
8.9 |
7.2 |
Mean Score |
8.27 |
7.70 |
7.83 |
Standard Deviation |
0.61 |
1.29 |
0.45 |
7. Huiping, Deanna, and Katya are three varsity divers who recently competed in an exhibition diving meet. Their diving scores for each of their six dives are shown in the above table. According to the data, which of the following is a valid conclusion?
A. Huiping dived the most consistently because her mean score is the highest.
B.Katya dived the most consistently because her standard deviation is the lowest.
C.Katya dived the least consistently because her mean score is the lowest.
D. Deanna dived the most consistently because her standard deviation is the highest.
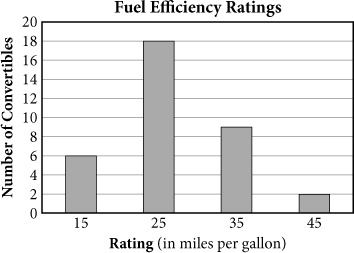
8. ![]() The bar graph above shows the number of convertibles made by several manufacturers with various fuel efficiency ratings. What is the mean fuel efficiency rating for these convertibles?
The bar graph above shows the number of convertibles made by several manufacturers with various fuel efficiency ratings. What is the mean fuel efficiency rating for these convertibles?
A. 25
B.27
C.30
D. 32
HINT: For Q9, start by determining the sum of the number of miles for all 10 days.
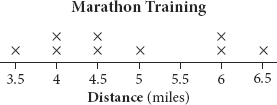
9. ![]() A runner is training for a marathon. His goal is to run an average of 5 miles per day for the first 10 days of his training. The dot plot above shows the number of miles he ran each day during the first 9 days. How many miles must he run on the 10th day to reach his goal?
A runner is training for a marathon. His goal is to run an average of 5 miles per day for the first 10 days of his training. The dot plot above shows the number of miles he ran each day during the first 9 days. How many miles must he run on the 10th day to reach his goal?
A. 5
B.5.5
C.6
D. 6.5
|
Year |
Number of Eligible Employees |
2010 |
n |
2011 |
874 |
2012 |
795 |
2013 |
732 |
2014 |
821 |
10. ![]() The table above shows the number of employees at a certain company who were eligible for group health insurance each year from 2010 to 2014. If the median number of eligible employees for the five years was 821, and no two years had the same number of eligible employees, what is the least possible value for n ?
The table above shows the number of employees at a certain company who were eligible for group health insurance each year from 2010 to 2014. If the median number of eligible employees for the five years was 821, and no two years had the same number of eligible employees, what is the least possible value for n ?
A. 733
B.796
C.822
D. 875
11. In a local rock climbing group, the mean novice member age is 22 years and the mean experienced member age is 26 years. Which of the following can be concluded about the average age, a, of the experienced and novice members of this rock climbing group?
A. 22 < a < 26
B.a = 24
C.a > 24
D. a < 24
HINT: Arrange the values in Q12 in ascending order to find the median and quickly identify the mode.
12. ![]() Data set K consists of the values 11, 4, 0, 7, 14, 1, 3, 7, and 13. Which of the following has the least value?
Data set K consists of the values 11, 4, 0, 7, 14, 1, 3, 7, and 13. Which of the following has the least value?
A. The mode of data set K
B.The median of data set K
C.The mean of data set K
D. One-half the range of data set K