PSAT/NMSQT Prep 2022 - Eggert M.D., Strelka A. 2022
Reflect
Tables, statistics, and probability
Data analysis
Directions: Take a few minutes to recall what you’ve learned and what you’ve been practicing in this chapter. Consider the following questions, jot down your best answer for each one, and then compare your reflections to the expert responses on the following page. Use your level of confidence to determine what to do next.
What are some common ways the PSAT may present data?
What is the difference between median, mode, and range?
What does the standard deviation of a data set tell you?
When can you generalize the results of a survey of a small group to a larger group?
What are two ways to calculate the probability of a single event?
Expert Responses
What are some common ways the PSAT may present data?
The PSAT may present data in tables, bar charts, line graphs, dot plots, and histograms.
What is the difference between median, mode, and range?
The median of a set is the middle value, whereas the mode is the most common value. The range of a set is thedistance between the smallest value and the largest one.
What does the standard deviation of a data set tell you?
A data set’s standard deviation reflects how far apart the numbers are from each other. The standard deviation of a set whose numbers are all the same—for example, {5, 5, 5, 5}—is 0. The greater the distance between thenumbers, the greater the standard deviation.
When can you generalize the results of a survey of a small group to a larger group?
A survey can be generalized to a larger population if the data sample is representative. To be representative, the data sample needs to be drawn at random from the larger population.
What are two ways to calculate the probability of a single event?
One way is to use the basic probability formula:
![]()
Alternatively, the probability that an event happens is 1 minus the probability that it doesn’t happen.
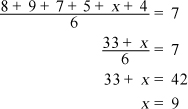
Next Steps
If you answered most questions correctly in the “How Much Have You Learned?” section, and if your responses to the Reflect questions were similar to those of the PSAT expert, then consider Tables, Statistics, and Probability an area of strength and move on to the next chapter. Come back to this topic periodically to prevent yourself from getting rusty.
If you don’t yet feel confident, review those parts of this chapter that you have not yet mastered, then try the questions you missed again. In particular, make sure that you understand the six terms explained in the Statistics lesson and the probability formulas explained in the Probability lesson. As always, be sure to review the explanations closely.
Answers and Explanations
1. A
Difficulty: Easy
Getting to the Answer: The question states that the data were collected in the Atlantic Ocean, so any conclusion drawn can be generalized only to that particular geographic region. Eliminate (C) and (D). The question defines the winter months as December, January, and February. According to the data, a greater volume of water moved during those months than during the summer months of June, July, and August, so (A) is correct.
2. B
Difficulty: Easy
Getting to the Answer: The question asks only about cars and trucks, so ignore the column for SUVs. The technician recommended a tire rotation for 48 cars and 36 trucks (a total of 84) out of the 94 + 64 = 158 cars and trucks that he serviced. This represents ![]() of the cars and trucks, making (B) correct.
of the cars and trucks, making (B) correct.
3. 264
Difficulty: Easy
Getting to the Answer: You know from the table that 27.8% of participants who were administered the drug experienced severe side effects. Add this to the 6.2% who had severe side effects while given the inert pill to get 34.0% total with severe side effects, meaning 100.0% − 34.0% = 66.0% did not have them. Using the three-part percent formula, you find 0.66 × 400 = 264 participants did not sustain severe side effects. Grid in 264.
4. 82
Difficulty: Medium
Getting to the Answer: From the previous question, you know that 264 trial participants did not have severe side effects; therefore, 400 − 264 = 136 participants did. The table indicates that 27.8% of the 400 participants were given the drug and sustained severe side effects, which equates to 0.278 × 400 ≈ 111 participants. So, 111 out of the 136 participants who had severe side effects were given the drug:
![]()
Be sure to round this up to the nearest whole percent, as indicated in the question. Grid in 82.
5. A
Difficulty: Medium
Getting to the Answer: According to the bar graph, the company’s yearly profits have been growing by about $10 million annually. To reach yearly profits that are 100% greater than (or double) its profits in 2013, the company would need yearly profits of 2 × $60 million = $120 million. This is $50 million more than in 2014. At $10 million more per year, reaching this target would take 5 more years. Thus, the company should double its 2013 profits in 2014 + 5 = 2019, which is (A).
6. 3/7 or .428
Difficulty: Medium
Getting to the Answer: According to the expression provided, you need the number of viewers and the total viewing audience:
Channel’s viewers = 20% of TV owners
= 0.20(4,100 + 3,400) = 0.2(7,500) = 1,500
Total viewing audience = 1,900 + 1,600 = 3,500
Nightly rating = ![]()
Grid in 3/7 or .428.
7. B
Difficulty: Easy
Getting to the Answer: Consider the difference between mean and standard deviation: mean is a measure of center, while standard deviation is a measure of spread. The four answers all involve diving consistency, which means the explanation should involve standard deviation. Eliminate (A) and (C). Higher diving consistency means lower standard deviation (and vice versa); the only choice that reflects this—and correctly represents the data in the table—is (B).
8. B
Difficulty: Easy
Getting to the Answer: The mean of a set of numbers is the same as the average, which is the sum of the values divided by the number of values. Use the graph to find the sum of the fuel efficiency ratings and then calculate the mean. To save time, multiply the frequency in each category by the rating and then divide by the total number of convertibles: (6 × 15) + (18 × 25) + (9 × 35) + (2 × 45) = 945, and there are 6 + 18 + 9 + 2 = 35 total convertibles, so ![]() . Choice (B) is correct.
. Choice (B) is correct.
9. C
Difficulty: Medium
Getting to the Answer: Understanding how averages and sums are connected is the key to answering a question like this. If the average of 10 numbers is 5, then the sum of the 10 numbers must be 50 (because ![]() ). Use the dot plot to find the total number of miles the runner has already run. Then, subtract this number from 50. The runner has already run 3.5 + 2(4) + 2(4.5) + 5 + 2(6) + 6.5 = 44 miles, so he needs to run 50 − 44 = 6 miles on the 10th day. Choice (C) is correct.
). Use the dot plot to find the total number of miles the runner has already run. Then, subtract this number from 50. The runner has already run 3.5 + 2(4) + 2(4.5) + 5 + 2(6) + 6.5 = 44 miles, so he needs to run 50 − 44 = 6 miles on the 10th day. Choice (C) is correct.
10. C
Difficulty: Hard
Getting to the Answer: The median is the middle number in a series of numbers. Arrange the number of employees from least to greatest, making sure that 821 is in the middle. Use n to balance out the number of eligible employees on either side of 821:
732, 795, 821, 874, n
or
732, 795, 821, n, 874
Because there are two numbers below the median (732 and 795), there must be two numbers above the median, 874 and n. Be careful—n could be on either side of 874. Since no two years had the same number, n could be anything greater than 821. Its least possible value is 822. Choice (C) is correct.
11. A
Difficulty: Hard
Getting to the Answer: To answer this question, you need to understand the assumptions each inequality makes to identify the correct one. Start with (A). This is a reasonable conclusion to draw because the question does not specify anything about the relative quantity of experienced and novice club members, so keep (A) as a possible correct answer for the moment. Choice (B) assumes there are equal numbers of experienced and novice members. Choice (C) assumes there are more experienced than novice members, while (D) assumes there are more novice than experienced members. Because no information on the relative numbers of each is given, (B), (C), and (D) are all incorrect, leaving (A) as the only option.
12. C
Difficulty: Medium
Getting to the Answer: First arrange the elements of data set K in increasing order: 0, 1, 3, 4, 7, 7, 11, 13, 14. The mode is 7 because that is the only value that appears twice. There are nine values, so the median is the fifth number, which is also 7. The mean is ![]() . Finally, the range is 14 − 0 = 14. One-half of that is 7. The mean has the least value, so (C) is correct.
. Finally, the range is 14 − 0 = 14. One-half of that is 7. The mean has the least value, so (C) is correct.
13. D
Difficulty: Medium
Getting to the Answer: A good representative sample is not only random but also a good representation of the population in question. Here, the population in question is American voters. Choice (A) could be tempting because it might be true that cell phone owners are more educated, and more educated voters may prefer more educated senators, but not everyone with a cell phone is a registered voter. For example, minors, noncitizens, and citizens who aren’t registered to vote are likely to make up at least a portion of the recipients of random texts sent out by the polling company. Since the survey is intended to sample voters, that is an important distinction. Thus, the inability to verify if the respondents were even registered to vote means that despite being randomly selected, the sample is unlikely to be a good representative sample. Choice (D) is correct.
14. C
Difficulty: Medium
Getting to the Answer: The study only looked at pollen allergies, so the sample was limited. You can eliminate (A) because not all allergies were included in the sample—you can’t say anything about them one way or the other. You can eliminate (B) by similar reasoning: the antihistamine found to be most effective for pollen allergies may or may not be the most effective one for other types of allergies as well; there is just no way to tell. You can eliminate (D) because the question doesn’t tell you anything about the data collection methods, so you can’t determine whether the study was biased. This means that (C) is correct—the study will be able to produce results concerning the effects of the antihistamines only on pollen allergies.
15. 315
Difficulty: Medium
Getting to the Answer: When making inferences about populations based on data from a random, representative sample, find the percent of the sample data that matches the given criterion and multiply by the total population. Of the 200 students in the sample, 200 − 42 − 48 − 60 = 50 students said they would like to watch cultural movies. This represents ![]() , or 25%. Multiply 0.25 × 1,260 to arrive at 315 students. Grid in 315.
, or 25%. Multiply 0.25 × 1,260 to arrive at 315 students. Grid in 315.
16. A
Difficulty: Hard
Getting to the Answer: The sample of households was randomly selected, so if ![]() (or 45%) of the surveyed households are not satisfied with their current providers, you can infer that 45% of the total households in the three counties are not satisfied with their providers. Multiply by the total number of customers in the population to find that 86,400 × 0.45 = 38,880 customers are not satisfied. Be careful—this is not the correct answer, so don’t choose (B). The company is confident that it can acquire 80% of these customers, or 38,880 × 0.80 = 31,104 customers. Choice (A) is correct.
(or 45%) of the surveyed households are not satisfied with their current providers, you can infer that 45% of the total households in the three counties are not satisfied with their providers. Multiply by the total number of customers in the population to find that 86,400 × 0.45 = 38,880 customers are not satisfied. Be careful—this is not the correct answer, so don’t choose (B). The company is confident that it can acquire 80% of these customers, or 38,880 × 0.80 = 31,104 customers. Choice (A) is correct.
17. B
Difficulty: Hard
Getting to the Answer: Fewer surveys than planned means a larger margin of error, so eliminate (C) and (D). And surveying significantly more fourth-year students than third-year students means the data will be skewed toward fourth-year students. Choice (B) is the only choice that specifies both effects.
18. 2/5 or .4
Difficulty: Easy
Getting to the Answer: According to the table, the students sold 126 boxes of berries and 74 boxes of exotic fruits. Add these together and divide by the total boxes sold to get ![]() . Grid in 2/5 or .4.
. Grid in 2/5 or .4.
19. C
Difficulty: Easy
Getting to the Answer: To calculate the percentage of all fruits that were bananas, simply find the total number of bananas sold, divide by the total pieces of fruit sold, and multiply by 100%:
![]()
Choice (C) is correct.
20. B
Difficulty: Medium
Getting to the Answer: You are asked about the percentage of sales of pineapples for each season. Thus, you will want to refer to the Pineapples row of the table. Use estimation strategies to determine percentages for each season:
Winter: 22 of 150 pieces of fruit sold in the winter were pineapples. Recognize that ![]() , so slightly less than
, so slightly less than ![]() (or ~17%) of the fruit sold in the winter were pineapples.
(or ~17%) of the fruit sold in the winter were pineapples.
Spring: 41 of 200 pieces of fruit sold in the spring were pineapples. You should recognize that ![]() , so the percentage of pieces of fruit sold that were pineapples is slightly above 20% in the spring.
, so the percentage of pieces of fruit sold that were pineapples is slightly above 20% in the spring.
Summer: 46 of 230 pieces of fruit sold in the summer were pineapples. The fraction ![]() actually reduces to exactly
actually reduces to exactly ![]() , so exactly 20% of the pieces of fruit sold in the summer were pineapples.
, so exactly 20% of the pieces of fruit sold in the summer were pineapples.
Fall: Only 11 of 170 pieces of fruit sold in the fall were pineapples. This ratio is very similar to ![]() , which is going to be much smaller than the percentages in the other three seasons.
, which is going to be much smaller than the percentages in the other three seasons.
Thus, (B) is the correct answer.
21. 40
Difficulty: Medium
Getting to the Answer: Read the question carefully to determine which rows and columns of the tables you will need. First, you are told that you are looking only at underclassmen, which are defined as freshmen and sophomores. Thus, you only need to consider the first two rows of the table. There are 100 + 135 = 235 underclassmen at the school. Next, you need to determine how many underclassmen either agreed or strongly agreed with the change of colors: 24 + 36 = 60 freshmen and 12 + 23 = 35 sophomores either agreed or strongly agreed with the change. Thus, the percentage of underclassmen who either agreed or strongly agreed with the new policy can be expressed as ![]() Round down and grid in 40.
Round down and grid in 40.
22. D
Difficulty: Hard
Getting to the Answer: The probability that one tree less than 3 years old randomly selected from those that were tested would have cankers is equal to the number of trees less than 3 years old that had cankers divided by the total number of trees less than 3 years old that were tested. This means you need only two numbers to answer the question. One of those numbers is in the second table—8 trees less than 3 years old had cankers. Finding the other number is the tricky part. Use information from the question stem and Table 1. The inspector tested 4% of the total number of trees less than 3 years old, or 4% of 15% of 2,500 trees. Multiply to find that 0.04 × 0.15 × 2,500 = 15 trees less than 3 years old were tested. This means the probability is ![]() , which matches choice (D).
, which matches choice (D).
23. 9
Difficulty: Medium
Category: Statistics
Strategic Advice: When the goal is to find a missing value in a set of data and the average is given, consider using the balance approach. We’ll demonstrate both approaches starting with the average formula.
Getting to the Answer: The question is about blue sportswear, so ignore the data for the other colors. The given numbers for blue sportswear are 8, 9, 7, 5, and 4. The average is given as 7. If you call the missing value x, plugging the known values into the average formula results in the following:
Grid in 9 as the correct answer.
Alternatively, to use the balance approach, write down how much each value is above or below the average of 7. For example, the value for jerseys is 1 above the average: 8 − 7 = 1.
|
Jerseys |
Shorts |
T-Shirts |
Tank Tops |
Sweatshirts |
Sweatpants |
8: +1 |
9: +2 |
7: 0 |
5: −2 |
4: −3 |
Now, observe that, excluding sweatshirts, the values are +1 + 2 + 0 − 2 − 3 = −2. Without the value for sweatshirts, the total is 2 less than what you’d expect based on the average. So for the values to balance out to the average, the sweatshirts’ value must be 2 more than the average of 7, or 7 + 2 = 9. Grid in 9.
24. B
Difficulty: Medium
Category: Tables and Graphs
Getting to the Answer: To calculate the percentage of people in each age group who had a high school diploma only, divide the number of people in that age group with only a high school diploma by the total number of applicants in that age group. Choice (B) is correct because ![]() , which is a lower percentage than that of the other age groups (18 to 25 ≈ 60.5%, 36 to 45 ≈ 42.3%, and Older than 45 = 50%).
, which is a lower percentage than that of the other age groups (18 to 25 ≈ 60.5%, 36 to 45 ≈ 42.3%, and Older than 45 = 50%).
25. B
Difficulty: Hard
Category: Probability
Getting to the Answer: The first criterion is fairly straightforward—the applicant must have a 2-year degree, so focus on that column in the table. The second criterion is a bit trickier—at least 26 years old means 26 years old or older, so you’ll need to use the values in the rows for 26—35, 36—45, and Older than 45. There were 19 in the 26—35 age group who had a 2-year degree, 13 in the 36—45 age group, and 2 in the Older than 45 age group, resulting in a total of 19 + 13 + 2 = 34 out of 112 applicants. The probability of randomly selecting one applicant from any of these three groups is ![]() , which reduces to
, which reduces to ![]() , so (B) is correct.
, so (B) is correct.
26. 15
Difficulty: Easy
Category: Tables and Graphs
Getting to the Answer: Read the graph carefully, including the key at the bottom that tells you that each bar represents a 3-hour period. The question tells you that a Kp Index of 5 or more indicates a solar flare. On September 11, the graph shows 4 bars at a Kp Index of 5 and 1 bar at a Kp Index of 6, for a total of five 3-hour periods during which a solar flare occurred. This represents a total of 5 × 3 = 15 hours. Grid in 15.
27. 5/40 or 1/8 or .125
Difficulty: Medium
Category: Probability
Getting to the Answer: Probability compares the number of desired outcomes (number of 3-hour periods with a Kp index greater than or equal to 5) to the total number of possible outcomes (total number of 3-hour periods between September 9 and September 13).
Count the number of bars in the graph that have a height of 5 or more—there are 5. Count the total number of bars—there are 8 for each of the 5 days, for a total of 40. This means there were five 3-hour periods out of 40 during which a solar flare occurred, so the probability of randomly selecting one of those periods is ![]() . You could also grid in the answer as .125.
. You could also grid in the answer as .125.
28. 1000
Difficulty: Hard
Category: Statistics
Getting to the Answer: Originally there were 15 theaters and they averaged 600 customers each per day for a total attendance of 15 × 600 = 9,000 per day. Even after the 6 theaters closed, the total attendance remained the same. Then, however, the number of theaters was 15 − 6 = 9, so recalculate the average as follows:
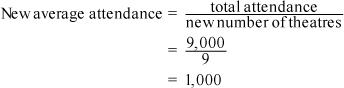
Grid in 1000.
29. 2304
Difficulty: Medium
Category: Tables and Graphs
Getting to the Answer: Use the information in the table to calculate how much it costs to run each theater—this will tell you how much the cinema saves by not running the theater. Then multiply by 6.
Electricity = $150
Trash Disposal and Cleaning = $80
Operational Staff = 1 at $11/hour × 14 hours = $154
Total = $150 + $80 + $154 = $384 per theater
The total savings is 6 × $384 = $2,304. Grid in 2304.
30. 19
Difficulty: Easy
Category: Tables and Graphs
Getting to the Answer: There are 9 babies below the healthy range and 15 babies above, so there are 9 + 15 = 24 total babies who fall above or below the range. There are 128 babies total, which means that ![]() of all the babies born at this hospital in 2018 were considered at-risk. Grid in 19.
of all the babies born at this hospital in 2018 were considered at-risk. Grid in 19.
31. 9/64 or .141
Difficulty: Medium
Category: Probability
Getting to the Answer: From the table, the numbers for Not a Participant/Below Range and Participant/Above Range are 8 and 10, respectively, with a total of 8 + 10 = 18. There were 128 babies born in the hospital in October 2018, so the probability of randomly selecting one from the two specified groups is ![]() . You could also grid this as .141.
. You could also grid this as .141.
32. D
Difficulty: Easy
Category: Tables and Graphs
Getting to the Answer: The question asks only about participants who experienced REM sleep, so focus on this row. Of the 125 participants who experienced REM sleep, 78 of them wore a contoured mask. This represents ![]() , or 62.4%, which is (D).
, or 62.4%, which is (D).
33. D
Difficulty: Easy
Category: Surveys and Data Samples
Getting to the Answer: The question asks about consumers who purchase a contoured mask, so focus on that column in the table. Assuming the participants in the study were a good representative sample, 78 out of 100, or 78%, of the 12,000 consumers should experience REM sleep. Multiply 0.78 × 12,000 to arrive at 9,360, which is (D).