PSAT/NMSQT Prep 2022 - Eggert M.D., Strelka A. 2022
Graphs of functions
Functions
Passport to advanced math
Learning objective
After this lesson, you will be able to:
· Identify the correct graph of a function
To answer a question like this:
|
x |
h(x) |
−3 |
−7 |
−2 |
−5 |
−1 |
0 |
0 |
3 |
1 |
11 |
2 |
23 |
3 |
40 |
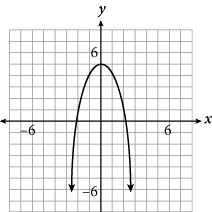
The minimum value of function g, whose graph is shown above, is m. Values for the function h are shown in the table above. What is the value of h(m)?
A. −7
B. −5
C. 0
D. 3
You need to know this:
Interpreting graphs of functions is similar to interpreting graphs of equations. For example:
Say the graph above represents the function f(x), and you’re asked to find the value of x for which f(x) = 6. Because f(x) represents the output value, or range, you can translate this to, “When does the y-value equal 6?” To answer the question, find 6 on the y-axis, then trace over to the function (the line). Read the corresponding x-value: it’s −2, so when f(x) = 6, x must be −2.
The PSAT may sometimes ask about a function’s maximum or minimum. These terms mean the greatest and least value of the function, respectively. This graph of f(x) does not have a maximum or minimum because the arrows on the line indicate that it continues infinitely in both directions. The preceding question, however, does show a function with a maximum.
You need to do this:
· Treat f(x) as the y-coordinate on a graph.
· The maximum and minimum refer to a function’s greatest and least y-coordinates, respectively.
Explanation:
Start by identifying m, which occurs at the lowest point of the function at (0, −3). The “minimum value of function g” means the least y-value, so m = −3. Next, use the table to find h(−3), which is the y-value for the x-value of −3. According to the table, when x = −3,h(x) = −7. Hence, (A) is correct.
Try on Your Own
Directions: Take as much time as you need on these questions. Work carefully and methodically. There will be an opportunity for timed practice at the end of the chapter.
HINT: For Q6, remember that f(x) and g(x) are found on the y-axis on the graphs.
6. In the figure shown above, what is the value of ![]()
A. −4
B.6
C.10
D. 14
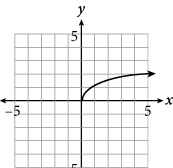
HINT: For Q7, the x-values determine the domain, while the y-values determine the range.
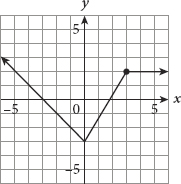
7. The graph of f(x) is shown above. Which of the following represents the domain and range of the function?
A. Domain: f(x) ≥ 5
Range: all real numbers
B.Domain: f(x) ≤ 5
Range: all real numbers
C.Domain: all real numbers
Range: f(x) ≥ 5
D. Domain: all real numbers
Range: f(x) ≤ 5
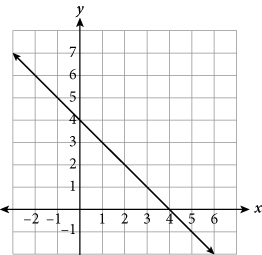
8. The figure shown above represents the function ![]() Which statement about the function is NOT true?
Which statement about the function is NOT true?
A. q(0) = 0
B.q(2) = 4
C.The range of q(x) is y ≥ 0.
D. The domain of q(x) is x ≥ 0.
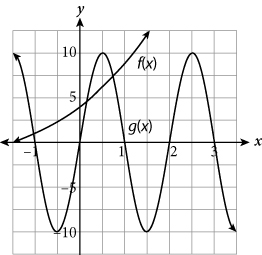
9. In the figure shown above, what is the value of f(3) − g(3)?
A. −3
B.0
C.3
D. 6
HINT: Begin Q10 by determining the maximum y-value.
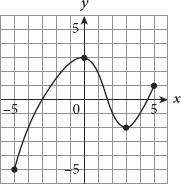
10. The function f(x) is graphed in the xy-plane above. If the maximum value of f(x) = z, what is the value of −f (z)?