CliffsNotes CBEST - BTPS TESTING Ph.D., Jerry Bobrow Ph.D. & 8 more 2021
Basic statistics review
Statistics and probability review
This section covers an introduction to the basic concepts of statistics. Statistics is a mathematical system for organizing, describing, and interpreting numerical data. Using data and information helps to find patterns that make general and specific statements about many real-life scenarios. For example, statistics can be used to evaluate grade point averages, determine college football rankings, predict weather pattern changes, and rate frequently viewed television shows.
Frequency Distribution
A frequency distribution table is a template used to organize data so that you can make sense of the numerical data collected from lowest to highest (called intervals). Generally, there is a column on the left (the data values) and a column on the right (the frequency), which indicates how many of each data value are in the data set.
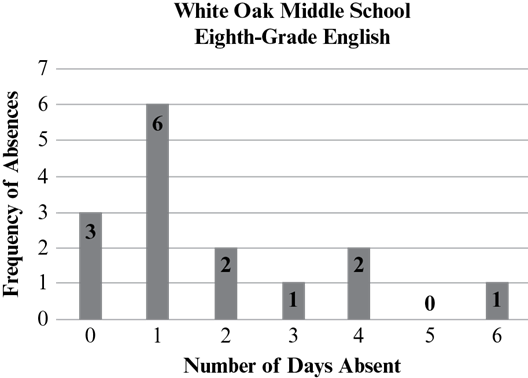
For example, a survey was taken in an eighth-grade English class at White Oak Middle School. The class of 15 students was asked how many times they were absent during the snowy month of January. The results were recorded as follows: 1, 0, 4, 1, 1, 2, 0, 3, 4, 1, 6, 1, 2, 0, 1.
To organize the results, the teacher tallied and recorded the student responses using a frequency table.
Note: x represents the number of days absent and f represents their frequency.
|
x |
f |
0 |
3 |
1 |
6 |
2 |
2 |
3 |
1 |
4 |
2 |
5 |
0 |
6 |
1 |
Although frequency distribution tables are useful to gather and organize data, these tables do not provide you with a good visual picture of what the data actually mean. This is why numerical data from a frequency table are often transferred to a graphical display (bar graph, line graph, etc.). Using the data collected in the frequency table above with one variable, the graphic display might look like this.
Measures of Central Tendency
A measure of central tendency describes any number in the middle of the data. It indicates the “center of a distribution.” The three most common measures of central tendency are mean (or arithmetic mean), median, and mode. Range is also a measure of central tendency.
Mean
The mean (also called the arithmetic mean) is also called the “average.”
To find the average of a group of numbers, take the following steps:
Step 1: Add all of the numbers in the data set.
Step 2: Divide by the total number of items in the set.
Examples:
1. What is the average of 10, 20, 35, 40, and 45?
10 + 20 + 35 + 40 + 45 = 150
Since there are five values, the total is divided by 5.
150 ÷ 5 = 30
The average is 30.
2. Find the mean of 27, 30, 28, 22, 25, and 28.
27 + 30 + 28 + 22 + 25 + 28 = 160
Since there are six values, the total is divided by 6.
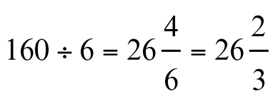
The mean is  . If the problem had asked for the answer to be rounded to the nearest whole number, the mean would be 27.
3. A student has test scores of 83, 67, 92, 88, and 79 in his science class. Find his mean test score.
83 + 67 + 92 + 88 + 79 = 409
Since there are five test scores, the total is divided by 5, or 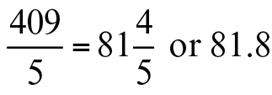 . If the problem had asked for the answer to be rounded to the nearest whole number, the mean would be 82.
Median
The median is the middle number when numbers are arranged from smallest to largest, or from largest to smallest. For any set of data, there is only one median. There are two methods to find the median in a group of numbers.
When working with an odd number of values, take the following steps:
Step 1: List all of the numbers from smallest to largest.
Step 2: Find the middle value. (Note: The same number of values are on either side.)
Examples:
1. What is the median of this group of numbers: 2, 2, 6, 5, 7, 9, 8, 8, 11?
2, 2, 5, 6, 7, 8, 8, 9, 11
The median is 7.
Now suppose the number of items in the data set is even. It would be impossible find a middle number. Therefore, the median is determined by finding the average (mean) of the two middle numbers.
When working with an even number of values, take the following steps:
Step 1: List all of the numbers from smallest to largest.
Step 2: Look for the middle two numbers and then find their average.
2. What is the median of this group of numbers: 2, 2, 6, 6, 5, 9, 8, 8, 8, 11?
2, 2, 5, 6, 6, 8, 8, 8, 9, 11
The middle values are 6 and 8; therefore, you must find the arithmetic mean of the two middle numbers.
6 + 8 = 14
14 ÷ 2 = 7
The median is 7.
3. Find the median of 63, 80, 85, 74, 71, 83, 53, and 82.
Since there is an even number of items in the data, the median is the average of the two middle numbers. Arranging the numbers from smallest to largest (or largest to smallest) yields 53, 63, 71, 74, 80, 82, 83, and 85. The two middle numbers are 74 and 80, whose average is
74 + 80 = 154
154 ÷ 2 = 77
The median is 77.
Mode
The mode is the number that appears the most frequently in a group of numbers. One difference between the mode, mean, and median is that there may be more than one mode or no mode for any given set of data.
Examples:
1. Find the mode of 18, 19, 13, 17, 18, 16, and 20.
The mode of 18, 19, 13, 17, 18, 16, and 20 is 18. It is the number that occurs most frequently in the given data.
2. Find the mode of 8, 10, 3, 6, 8, 9, 7, and 3.
The mode of 8, 10, 3, 6, 8, 9, 7, and 3 is 3 and 8 since they both occur twice in the given data.
3. Find the mode of a set of quiz scores: 85, 86, 87, 87, 87, 91, 91, 93, 95, 99.
Since the number 87 is repeated most often, the mode in this set of quizzes is 87.
Range
The range is the difference between the largest number and the smallest number.
To find the range of a group of numbers, subtract the smallest value from the largest value.
largest value — smallest value = range
Examples:
1. Find the range of the scores 3, 2, 7, 9, 12.
The largest score is 12 and the smallest score is 2. Therefore, 12 — 2 = 10. The range is 10.
2. According to the graph below, what is the range between the lowest score and highest score on the history pop quiz?
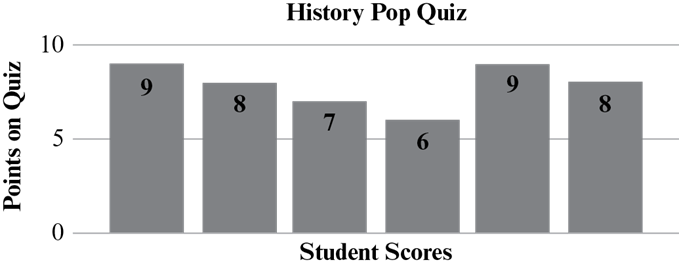
The highest score is 9 and lowest score is 6. Therefore, the range is 9 — 6 = 3.
Interpreting Standardized Test Scores
CBEST test-takers should have a basic knowledge of analyzing standardized test scores. Standardized tests are designed to measure an individual student’s performance compared to a large group of students.
Although interpreting test scores may appear a challenging task, the primary focus of the CBEST is to use a few commonly used terms that help teachers read and understand test results. Recognizing the format of standardized test reports will help you assess student performance. Terms you should know are raw score, percent score, percentile score, and stanine score.
Raw Score
The raw score is simply the number of correct answers on a given test. For example, if a student answers 80 problems correctly out of 100 possible questions, the raw score is 80. If the student answers 80 problems correctly out of 85 possible questions, the raw score is still 80.
Percent Score
The percent score is the number of questions answered correctly compared to the total number of questions. For example, if a student answers 80 questions correctly out of a possible 100 questions, the student’s percent score is 80%. If the student answers 80 questions correctly out of 85 possible questions, the student’s percent score is 94%.
Percentile Score
The percentile score is based on the student’s “standing” within a group. The percentile score is ascertained from the percentage of test-takers who score the same or below the student’s score. For example, if an exam is taken by 100 students, has 200 questions, and the student answers 100 questions correctly, the student will have a raw score of 100 and a percent score of 50%. If 85 of the 100 students have a percent score of 50% or below, then the student will have a score better than or equal to 85% of the test-takers and will have scored in the 85th percentile.
Stanine Score
Stanine scores are based on a simple method that compares a student’s performance to other students at the same grade level. The term stanine is a contraction of “standard nine.” Stanine scores convert percentile scores into a single-digit number from 1 to 9. The lowest score is 1 and the highest score is 9. For example, a stanine score of 5 is the middle or “average” score.
|
Rank |
Percentile |
Stanine |
High |
96—99 |
9 |
89—95 |
8 |
|
77—88 |
7 |
|
Average |
60—76 |
6 |
41—59 |
5 |
|
24—40 |
4 |
|
Low |
12—23 |
3 |
5—11 |
2 |
|
1—4 |
1 |
Examples:
1. An eighth-grade English teacher notices that one of his students, Angela, is struggling in class. The teacher reviews Angela’s English standardized test results to determine intervention and placement strategies.
|
Raw Score |
Percentile |
Stanine |
55 |
45 |
5 |
2. Which of the following is a true statement regarding Angela’s stanine test score?
A. Angela answered 45% of the questions correctly.
B. Angela’s raw score and percentile show that she scored above average.
C. Angela achieved a score that is higher than 55% of other students who took the test.
D. Angela’s performance was at the same level as other students who took the test.
E. Angela answered 55% of the questions correctly.
Choice A is incorrect because answering 45% of the questions correctly makes an assumption that there was a total of 100 questions. The test could have consisted of any number of questions. Choice B is incorrect since raw scores and percentile scores are different, and this question is about stanine scores. Choice C is incorrect because Angela achieved a (percentile) score that is higher than 45% of the other students who took the test. Choice E is incorrect because we don’t know the percentage of correctly answered questions. A stanine test score of 4, 5, or 6 shows that her score is average and that she performed at the same level as other students who took the test. Only choice D shows the correct meaning of stanine scores.
2. Luke took a standardized math test, and his grade report showed that his score was in the 79th percentile. Which of the following is the best interpretation of the meaning of this percentile?
A. Luke got 79% of the problems correct.
B. Seventy-nine percent of all those taking the exam had scores below Luke’s score.
C. Seventy-nine percent of all those taking the exam had scores above Luke’s score.
D. Only 79% of those taking the exam received passing scores.
E. There was a 79% probability that his score was above the mean on the exam.
The percentile associated with a score represents how many whole percent of all scores lie below that score. Therefore, if a score is in the 79th percentile, this means that 79% of all other scores are below that score. The correct answer is choice B.