CliffsNotes CBEST - BTPS TESTING Ph.D., Jerry Bobrow Ph.D. & 8 more 2021
Graph interpretation
Math reasoning problems
Graph interpretation problems (also called data interpretation) draw on your knowledge of reasoning, arithmetic, and graph analysis. On the CBEST, you will need to understand and interpret real-world scenarios presented in graphs, charts, tables, and diagrams, and
· Understand data entry and information given.
· Find missing information.
· Use numerical information to solve math problems.
· Work with circle, bar, and line graphs.
Strategies to Solve Graph Interpretation Problems
Read the following general strategies that apply to graph interpretation questions before you study the suggested exercises that follow.
· Stay focused on the question. Unless you are told otherwise, use only the information given in the graph or diagram to answer the question.
· Skim the graph. Briefly skim the question and quickly examine the whole graphic display before starting to work on the problem. By scanning the graphic display first, you will have a general picture of the topic and its content before you look at specific data.
· Read the headings. Sometimes the answer to a question is available in the heading information given with a graph. Look for obvious, dramatic trends (high points or low points) and look at the headings that clarify the data (legends, units of measurement, or labels). Do not try to memorize the data; just get a general sense of the overall picture.
· Use your knowledge of math logic. You do not need to have strong math skills to answer graph interpretation questions, but knowledge of math reasoning will help you determine if your answer makes logical sense.
· Practice. Memorize and practice the possible types of graph interpretation questions before your exam.
Remember that you must accurately read and draw conclusions about the graph before performing calculations. Always read the title, labels, and values (if available) when interpreting graphs.
Types of Graphs
· Circle (pie) graphs
· Bar graphs
· Line graphs
· Venn diagrams
· Tables and charts
Circle (Pie) Graphs
Circle graphs show comparisons and are used to show relative proportions (fractions) of a whole circle. They are especially good visual representations of percentage problems. Circle graph amounts always total 100%. For example, a circle graph shows the relationship between a whole circle (100%) and portions (slices) of the circle called sectors. The size of each sector compared to the whole circle represents the ratio of the individual categories to the whole circle.
Examples:
1. According to the following graph, what is the ratio of the amount spent on housing to the amount spent on tuition?
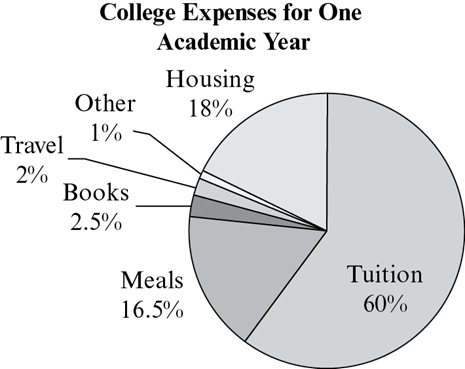
The circle graph shows a comparison of a student’s college expenses for one academic year. Since housing accounted for 18% of college expenses and tuition accounted for 60% of college expenses, the ratio of the amount spent on housing to the amount spent on tuition is  .
.
Questions 2—4 refer to the following graph.
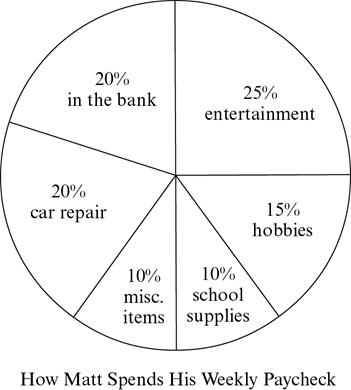
2. Matt earmarks ![]() of his weekly paycheck toward
of his weekly paycheck toward
A. his hobbies.
B. car repairs.
C. entertainment.
D. school supplies.
E. the bank.
To answer this question, you must be able to read the graph and apply some simple math calculations. Notice how the information is given in the circle graph. The graph shows percentages and the question shows a fraction.
To change a fraction to a percent:
1. Multiply by 100.
2. Divide by the denominator (bottom part of the fraction).
3. Insert a percent sign.
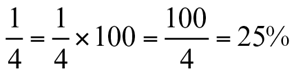
One-quarter is the same as 25%, so entertainment is the answer you are looking for. The correct answer is choice C.
3. If Matt receives a weekly paycheck of $1,000, how much money will he put in the bank?
A. $20
B. $200
C. $350
D. $800
E. $1,000
To answer this question, you must again read the graph carefully and apply some simple math. Matt puts 20% of his income in the bank, and 20% of $1,000 is $200. To solve this: 20%(1,000) = 0.20(1,000) = 200.
Matt, thus, puts $200 in the bank. The correct answer is choice B.
Remember, when changing a percent to a decimal, eliminate the percent sign and move the decimal point two places to the left; for example, 20% becomes 0.20 or 0.2.
4. The ratio of the amount of money Matt spends on his hobbies to the amount he puts in the bank is
A. ![]()
B. ![]()
C. ![]()
D. ![]()
E. ![]()
To answer this question, you must use the information in the graph to make a ratio.
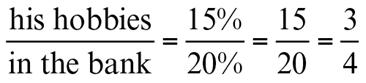
Notice that the ratio of 15%:20% reduces to ![]() . The correct answer is choice D.
. The correct answer is choice D.
Bar Graphs
A bar graph (histogram) is commonly used to quickly compare data or frequencies. The bars (columns) can be either vertical or horizontal and can appear as single bars, a group of bars, or stacked bars. The bars should be labeled to indicate the differences between the various categories. When answering a bar graph question, always try to determine the relationship between the columns in a graph or chart.
Examples:
5. In hundreds of miles of railroad track, how much more was in use in France in 1895 than in Spain in 1915?
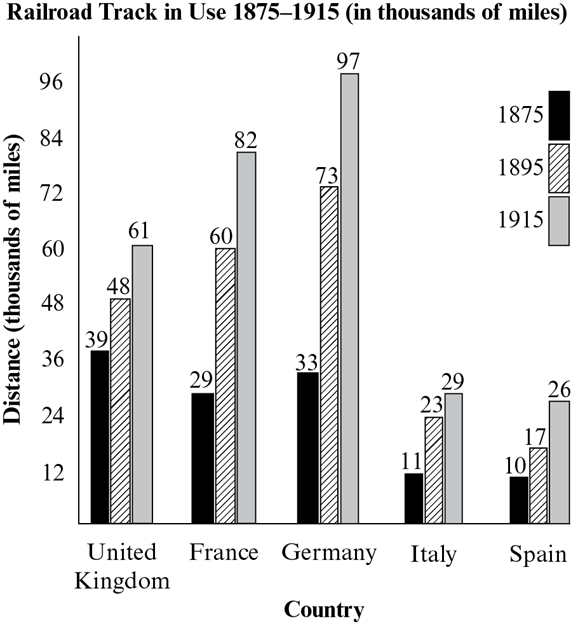
To answer this bar graph question, be aware that the information given in railroad track miles is in thousands of miles and the question asked for an answer in hundreds of miles. For example, 2 thousand miles would be 20 hundred miles. France in 1895 had 60 thousand miles of railroad track, and Spain in 1915 had 26 thousand miles of railroad track. The difference is 34 thousand miles of railroad track, which, in hundreds, is 340 hundred miles of railroad track.
Questions 6—7 refer to the following graph.
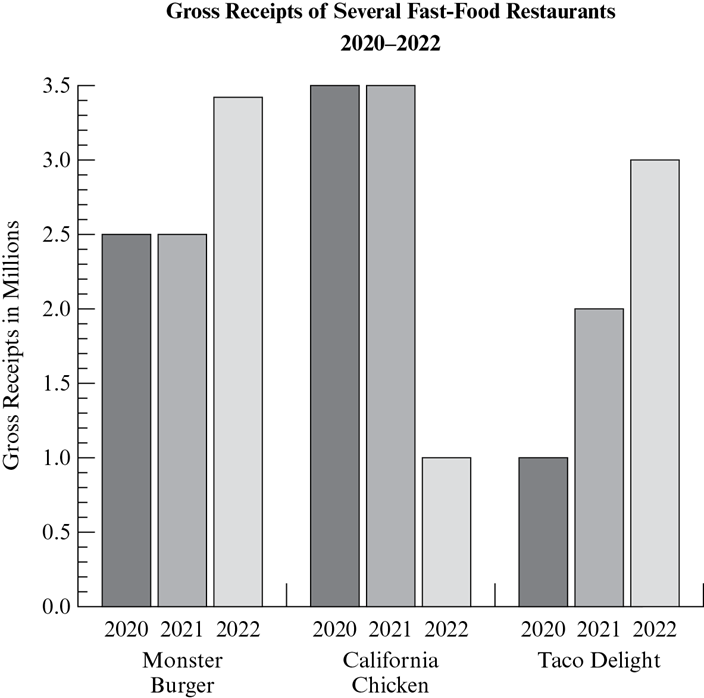
6. The 2020—2022 gross receipts of Monster Burger exceeded those of Taco Delight by approximately how much?
A. 0.2 million
B. 2 million
C. 8.2 million
D. 8.4 million
E. 17 million
The correct answer is B.
In this graph, multiple bars represent each fast-food restaurant; each single bar represents the receipts from a single year.
You may be tempted to write the numbers as you do your arithmetic (3.5 million = 3,500,000), but this is unnecessary. Because all the measurements are in millions, adding zeros does not add precision to the numbers.
Referring to the Monster Burger bars, you can see that gross receipts are as follows: 2020 = 2.5 million,
2021 = 2.5 million, 2022 = 3.4 million (if you have trouble seeing how the bars line up with the numbers, you can use your answer sheet as a straightedge to determine a number such as this last one). Totaling the receipts for all 3 years gives you 8.4 million.
Referring to the Taco Delight bars, you can see that gross receipts are as follows: 2020 = 1 million, 2021 = 2 million, 2022 = 3 million (don’t designate numbers beyond the nearest tenth, because the graph numbers and the answer choices prescribe no greater accuracy than this). Totaling the receipts for all 3 years gives you 6 million.
So Monster Burger exceeds Taco Delight by 2.4 million. The answer that best approximates this figure is 2 million, choice B.
7. From 2021 to 2022, the percent increase in receipts for Taco Delight exceeded the percent increase for Monster Burger by how much?
A. 0%
B. 2%
C. 10%
D. 14%
E. 43%
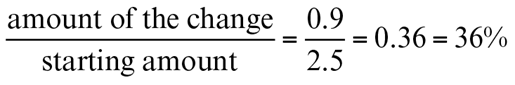
Graph questions on the CBEST may ask you to calculate percent increase or percent decrease. The formula for figuring either of these is the same:

In this case, you may first calculate the percent increase for Monster Burger:
Gross receipts in 2021 = 2.5 million
Gross receipts in 2022 = 3.4 million
Amount of the change = 0.9 million
The 2021 amount is the “starting” or “from” amount:
Percent increase for Taco Delight:
Gross receipts in 2021 = 2 million
Gross receipts in 2022 = 3 million
Amount of the change = 1 million
So, Taco Delight exceeds Monster Burger by 50% — 36% = 14%, choice D.
Line Graphs
A line graph converts data into points on a grid. Notice the slopes of lines connecting the points. These lines will show increases and decreases. The steeper the line slants upward toward the right, the greater the increase. The steeper the line slants downward toward the right, the greater the decrease. This type of graph provides a good visual picture of trends or changes in data over a period of time. It can be valuable in hypothesizing predictions over time.
Questions 8—9 refer to the following graph.
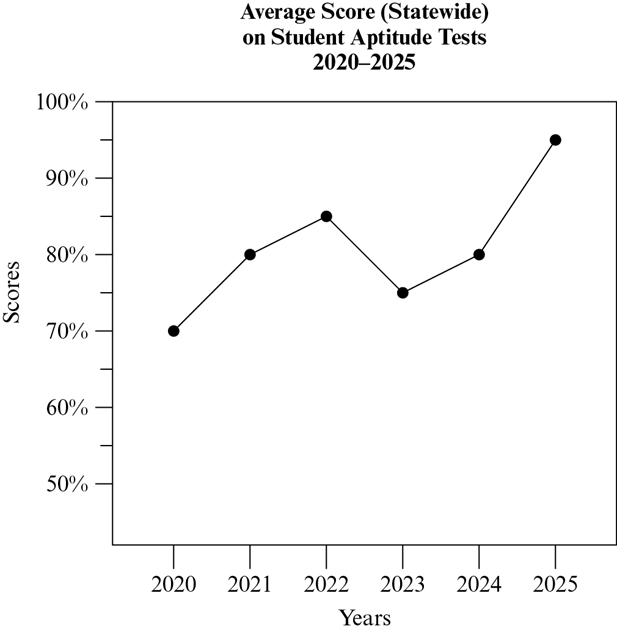
8. In which year was the average score approximately 85%?
A. 2020
B. 2021
C. 2022
D. 2023
E. 2024
According to the graph, the average test score was approximately 85% in 2022. In such cases, when you must read the graph for a precise measurement, remember that it may be helpful to use your answer sheet as a straightedge to compare points more accurately with the grid marks along the side. The correct answer is choice C.
9. Approximately what was the highest score achieved statewide on the test?
A. 80%
B. 85%
C. 90%
D. 7%
E. This cannot be determined from the information given.
The first step when confronted with a graph or chart is to read its title to understand what the graph is telling you. In this case, the graph is relating information about average scores. It tells you nothing about the highest score achieved. The correct answer is choice E.
10. According to the following graph, what was the approximate percent decrease in the average high temperature from August to December? Round your answer to the nearest percent.
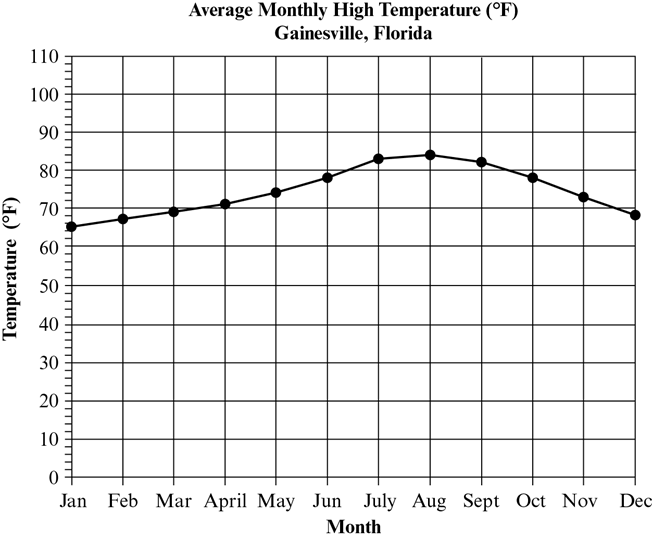
This line graph shows that the average high temperature dropped from approximately 85° in August, to approximately 70° in December for a decrease of 15°.

Venn Diagrams
A Venn diagram is a useful method to visually represent two or more sets and to illustrate whether or not the sets have any elements in common. Sets are generally represented as circles or ovals, but other geometric figures can be used. Sets that have elements in common will overlap, while sets that have no elements in common are shown disjointed from each other.
11. What conclusion can be drawn from the following diagram?
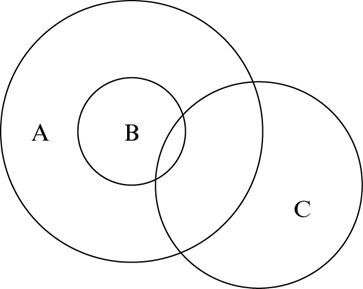
A. Circles A and B have nothing in common.
B. Circles A and C have nothing in common.
C. Circles B and C have nothing in common.
D. Circle C has something in common with circles A and B.
E. Not enough information is given to draw a conclusion.
Because circle C intersects (overlaps) with circles A and B, it must have something in common with A and B, as the shaded area in the following figure shows.
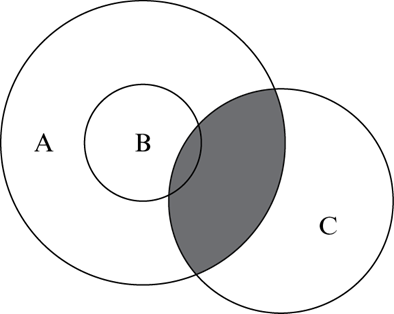
The correct answer is choice D.
12. According to the following diagram, what percent of all the students at Hollywood High are not enrolled in history?
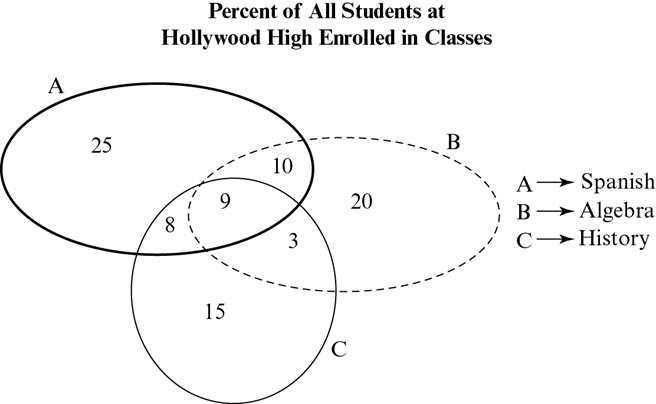
Assumptions: In this Venn diagram, region A represents the percentage of students at Hollywood High taking Spanish, region B represents the percentage of students at Hollywood High taking algebra, and region C represents the percentage of students at Hollywood High taking history.
Only looking at region A and the regions it overlaps, we can make the following conclusions from the diagram:
· 25% of the students at Hollywood High take Spanish but do not take either algebra or history.
· 10% of the students at Hollywood High take Spanish and algebra, but not history.
· 9% of the students at Hollywood High take Spanish, algebra, and history.
· 8% of the students at Hollywood High take Spanish and history, but not algebra.
One approach to help you answer this question is to take the percentage of students who are enrolled in history, then subtract that from 100%. According to the diagram, there are 8% + 9% + 3% + 15% = 35% of the students taking history; thus, there are 100% — 35% = 65% of the students not taking history.
Another approach is to add the percentages indicated outside of history and be sure to add in the 10% who are not taking any of the three classes.
Tables and Charts
A table or chart is often used to organize lists of data in a more readable and organized format. Charts often help to effectively view multiple values of data simultaneously, making it easier to compare and compute averages or ranges.
Be sure that you understand the information that is given in the chart or table. Column headings and line items give the important information. Titles give the numbers meaning.
The following chart shows the number of burger sales for the week of August 8—14. The days of the week are along the left side of the chart. The number of hamburgers sold for each day is given in the first column and the number of veggie burgers sold is in the second column.
Questions 13—14 refer to the following table.
Burger Sales for the Week of August 8—14
|
Day |
Hamburgers |
Veggie Burgers |
Sunday |
120 |
92 |
Monday |
85 |
80 |
Tuesday |
77 |
70 |
Wednesday |
74 |
71 |
Thursday |
75 |
72 |
Friday |
91 |
88 |
Saturday |
111 |
112 |
13. On how many days were more hamburgers sold than veggie burgers?
A. 7
B. 6
C. 5
D. 4
E. 3
To answer this question, you must compare the sales for each day. Hamburgers outsold veggie burgers every day except Saturday. The correct answer is choice B.
14. If the pattern of sales continues,
A. the weekend days will have the fewest number of burger sales next week.
B. the veggie burgers will outsell hamburgers next week.
C. generally, when hamburger sales go up, veggie burger sales will go up.
D. hamburgers will be less expensive than veggie burgers.
E. more customers will buy hamburgers than veggie burgers next Saturday.
To answer this question, you must notice one of the trends. Most days that hamburger sales go up, veggie burger sales also go up (with the exception of Saturday and Sunday). If you cannot recognize what the correct answer is, see if you can eliminate some choices. Since weekend days had greater sales than weekdays, choice A is incorrect. Since veggie burgers only outsold hamburgers once during the week, choice B is incorrect. Since the chart makes no indication of how expensive either type of burger is, choice D is incorrect. Choice E is incorrect because veggie burgers outsold hamburgers on Saturday. The correct answer is choice C.