Student's guide to writing college papers, Fourth edition - Kate L. Turabian 2010
Choosing the graphical form that best achieves your intention
Presenting evidence in tables and figures
Writing your paper
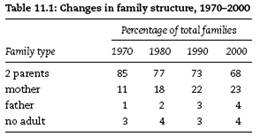
When you graphically present data as complex as that paragraph above, you can choose a table, a bar chart, or a line graph. Each communicates something different to readers.
A table seems precise and objective. It emphasizes individual numbers and forces readers to figure out relationships or trends (unless you state them in an introductory sentence):
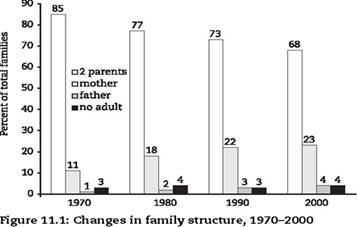
Charts and line graphs communicate specific values less precisely than a table, but their images communicate their message quickly and with greater impact. They also have different effects:
✵ A bar chart emphasizes comparisons among discrete items that can be seen at a glance.
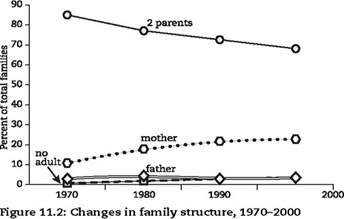
✵ A line graph emphasizes the story of trends over time:
Decide on the effect you want, then choose the graphic that fits. Do not choose the first form that comes to mind or the one you found in your source.
CAUTION
Your Software Likes Your Graphics Fancy, Your Readers Like Them Simple
Your computer software will encourage you to use many more graphics than we cover here, but stick to the basics. Unless you have lots of experience creating graphics, limit your choices to tables, bar charts, and line graphs. Even if you have experience, avoid most of the choices your software allows: no merely decorative colors, no 3-D graphics, no fancy graphics when a simple one will do. You don't improve your report with graphics that look dazzling but confuse or distract readers.