Student's guide to writing college papers, Fourth edition - Kate L. Turabian 2010
Designing tables and figures
Presenting evidence in tables and figures
Writing your paper
You use graphics to present quantitative data that serve as evidence in support of your reasons. So you must design them to communicate two things: what the data are and how they support your reason.
11.3.1 Tell Readers What Your Graphic Shows
A graphic representing complex numbers rarely speaks for itself. You must introduce and label it so that readers know both what to see in it and how it is relevant to your argument.
For example, readers have to study table 11.2 closely to see how it supports its claim:
Most predictions about gasoline consumption have proved wrong.claim
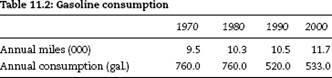
To see the connection, we need a more specific claim, a table title that better identifies what the numbers represent, highlighting that draws our eye to the most important data, and another sentence that explains how the numbers relate to the claim:
Gasoline consumption did not grow as many had predicted.claim Even though Americans drove 23 percent more miles in 2000 than in 1970, they used 32 percent less fuel.
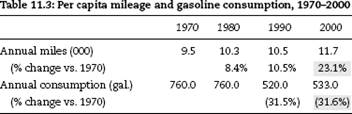
That added information tells readers how to interpret the key data in table 11.3.
How to Set Up a Graphic
1. Introduce each table or figure with a sentence that states how the data support your point. Include in that sentence any specific number that you want readers to focus on. (That number must also appear in the table or figure, visually highlighted if possible.)
2. Label every table and figure in a way that describes its data.
✵ For a table, the label is called a title and is set flush left above.
✵ For a figure, the label is called a caption (or legend) and is set flush left below.
Keep titles and captions short but descriptive enough to indicate exactly what the data represent and to differentiate each graphic from every other one. Do not use the label or caption to imply a claim about the figure:
Not: Weaker effects of counseling on depressed children before professionalization of staff, 1995—2004
But: Effect of counseling on depressed children, 1995—2004
3. Put into a table or figure information that helps readers see how the data support your point. For example, if numbers in a table show a trend and the size of the change matters, add the change to the final column. Or if a line on a graph changes in response to an influence not mentioned on the graph, add text to the image to explain it.
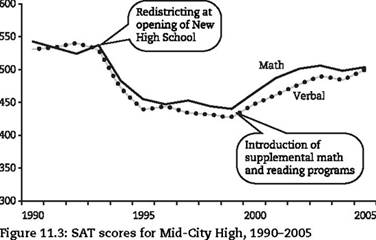
All of the framing elements work to make figure 11.3 easy to understand: (1) The introductory sentence explains what the graph shows and points out not only the trend but what readers should see in it; (2) the label tells readers what the data represent; and (3) the inserted callouts explain the important changes in the data.
Although reading and math scores initially declined by almost 100 points following redistricting, that trend was substantially reversed by the introduction of supplemental math and reading programs.
11.3.2 Keep the Image as Simple and Informative as Its Content Allows
Some guides encourage you to put as much data as you can in every graphic, and most software encourages you to make them visually complex. But readers want to see only the data relevant to your claim, presented in an image free of distractions. As a new researcher, you can let your software take care of most of the effort in designing your graphics, but you'll have to change several default settings. Follow these guidelines.
For all graphics:
✵ Don't put a box around a graphic unless you group two or more figures.
✵ Never color or shade the background.
✵ Plot data on three dimensions only when you cannot display the data in any other way and your readers are familiar with such graphs.
For tables:
✵ Never divide columns and rows with both horizontal and vertical lines. Use light gray lines in one direction only if a table is complex.
✵ For tables with many rows, lightly shade every fifth row.
✵ Clearly label rows and columns.
✵ Order rows and columns by a principle that lets readers quickly find what you want them to see. Do not automatically choose alphabetic order.
✵ Sum totals at the bottom of a column or at the end of a row, not at the top or left.
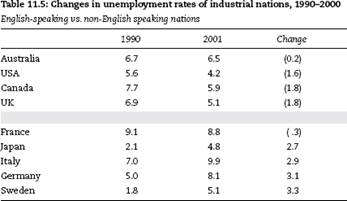
Compare tables 11.4 and 11.5. Table 11.4 looks cluttered and its items aren't helpfully organized:
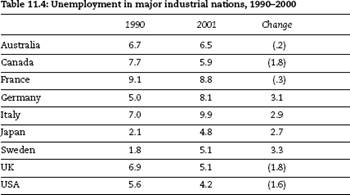
In contrast, table 11.5 is clearer because its title is more informative, the table has less distracting visual clutter, and its items are organized to let us see patterns more easily.
For bar charts:
✵ Do not use grid lines unless the graphic is complex. Make all grid lines light gray.
✵ When specific numbers matter, add them to bars or segments.
✵ Clearly label both axes.
✵ Color or shade bars only to show a contrast.
✵ Never use three-dimensional or iconic bars (for example, images of cars to represent automobile production). They add nothing, distort how readers judge values, and look amateurish.
✵ Group and arrange bars to give readers an image of an order that matches your point.
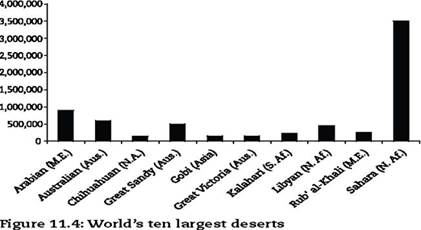
For example, look at figure 11.4 in the context of the explanatory sentence before it. The items are listed alphabetically, an order that doesn't help readers see the point.
Most of the desert area in the world is concentrated in North Africa and the Middle East:
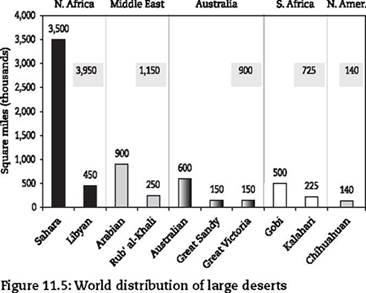
In contrast, figure 11.5 supports the claim with a coherent image.
Most of the desert area in the world is concentrated in North Africa and the Middle East:
CAUTION
Avoid Pie Charts
Most data that fit a bar chart can also be represented in a pie chart. It is a popular choice in magazines, tabloids, and annual reports, but it's harder to read than a bar chart, and it invites misinterpretation because readers must mentally compare proportions of segments whose size is hard to judge accurately. Most researchers consider them amateurish. Use bar charts instead.
For line graphs:
✵ Use grid lines only if the graphic is complex. Make all grid lines light gray.
✵ If you have fewer than ten data points, indicate them with dots. If only a few are relevant, add numbers to show their value.
✵ Choose the variable that makes the line go in the direction, up or down, that supports your point. If the good news is a reduction (down) in high school dropouts, you can more effectively represent the same data as an increase (up) in retention.
✵ Do not plot more than six lines on one graph unless you cannot make your point in any other way.
QUICK TIP
Try Out Different Graphics
If you are new to using graphics, all of these rules and principles can make your choice of graphics confusing. You can cut through that confusion if you try out several ways to represent the same data (your computer program will usually let you do that quickly). Then ask someone unfamiliar with the data to tell you what they see in each graphic. You might also ask them to judge the alternatives for impact and clarity.