PSAT/NMSQT Prep 2019 - Princeton Review 2019
Functions
Passport to advanced math
Math
CHAPTER OBJECTIVES
By the end of this chapter, you will be able to:
1. Use function notation to answer questions containing equations, tables, and/or graphs
2. Interpret functions and functional statements that represent real-world scenarios
3. Combine functions using basic operations and compute compositions of functions
4. Determine when a function is increasing, decreasing, or constant and apply transformations to a given function or functions
SMARTPOINTS
|
Point Value |
SmartPoint Category |
|
50 points |
Functions |
Prepare
FUNCTIONS
Functions act as rules that transform inputs into outputs, and they differ from equations in that each input must have only one corresponding output. For example, imagine a robot: every time you give it an apple, it promptly cuts that apple into three slices. The following table summarizes the first few inputs and their corresponding outputs.
|
Domain, x: # apples given to robot |
Range, f (x): # slices returned by robot |
|
0 |
0 |
|
1 |
3 |
|
2 |
6 |
|
3 |
9 |
From, the table you see that the output will always be triple the input, and you can express that relationship as the function f (x) = 3x (read “f of x equals three x”).
PSAT questions, especially those involving real-world situations, might ask you to derive the equation of a function, so you’ll need to be familiar with the standard forms. Following is the standard form of a linear function:
f (x) = kx + f (0)
The input, or domain, is the value represented by x. Sometimes the domain will be constrained by the question (e.g., x must be an integer). Other times, the domain could be defined by real-world conditions. For example, if x represents the time elapsed since the start of a race, the domain would need to exclude negative numbers. The output, or range, is what results from substituting a domain value into the function and is represented by f(x). The initial amount, or y-intercept, is represented by f(0)—the value of the function at the very beginning. If you think this looks familiar, you’re absolutely right. It’s just a dressed-up version of the standard y = mx + b equation you’ve already seen. Take a look at the following table for a translation:
|
Function Notation |
What It Represents |
Slope-Intercept Counterpart |
|
f(x) |
dependent variable or output |
y |
|
k |
rate of change, slope |
m |
|
f(0) |
y-intercept or initial quantity in a word problem |
b |
As you might have guessed, an exponential equation has a standard function notation as well. Here we’ve used g in place of f for visual clarity. Know that the letter used to represent a function (f, g, h, etc.) is sometimes arbitrarily chosen.
g(x) = g(0)(1+ r)x
Just as before, g(0) represents the initial amount and r represents the growth (or decay) rate. Recognizing that function notation is a variation of something you already know will go a long way toward reducing nerves on Test Day. You should also note that graphing functions is a straightforward process. In the examples above, just replace f(x) or g(x) with y and enter it into your graphing calculator.
Note
A quick way to determine whether an equation is a function is to conduct the vertical line test: if a vertical line passes through the graph of the equation more than once for any given value of x, the equation is not a function.
Below is an example of a test-like question about functions:
1. If f (x) = x 2 — x for all x ≤ —1 and f (x) = 0 for all x > —1, which of the following could not be a value of f (x) ?
1. — 4
2. 0
3. 2
4. 4
Use the Kaplan Method for Math to solve this question, working through it step-by-step. The following table shows Kaplan’s strategic thinking on the left, along with suggested math scratchwork on the right.
|
Strategic Thinking |
Math Scratchwork |
|
Step 1: Read the question, identifying and organizing important information as you go The question is asking for the answer choice that could not be in the range of this function. |
|
|
Step 2: Choose the best strategy to answer the question How can you determine which of the four choices is not part of the range? You’ll need to examine each piece of the domain individually to learn more. First, summarize each piece of the domain description. Can you use the domain information to eliminate any answer choices? What happens when x > —1? Because the range is 0 when x > —1, you can eliminate B. Would your knowledge of number properties be helpful for the second domain component? |
domain x ≤ −1: range = x2 − x
|
|
Absolutely. Because the range x 2 − x only applies when x ≤ —1, you only need to consider what happens when a negative number less than —1 is substituted for x. No matter what number you use, your output will always be positive. Eliminate C and D. |
(negative)2 − negative → |
|
Step 3: Check that you answered the right question The range of f (x) consists of only positive numbers, so (A) is correct. |
—4 is not positive |
Once broken into simpler pieces, this function question became much easier. Read on for more information about other ways the PSAT can test your knowledge of functions.
Note
You might be tempted to plug the answer choices in and solve for x, but this will cost you valuable time. Use this strategy only if you can’t approach the question in any other way. The PSAT will reward you for knowing the quickest way to answer the question, which in this case involves knowing number properties.
FUNCTIONS DEFINED BY TABLES AND GRAPHS
The ability to interpret the graph of a function will serve you well on Test Day. To interpret graphs of functions, you’ll need to utilize the same skills you use to interpret “regular” equations on the coordinate plane, so this material shouldn’t be completely foreign.
You know from the first part of this chapter that a function is merely a dressed-up equation, so translating from function to “regular” notation or vice versa is a straightforward process. Consider the following brief example:
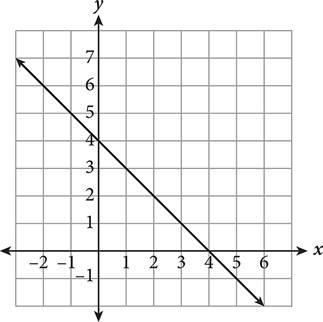
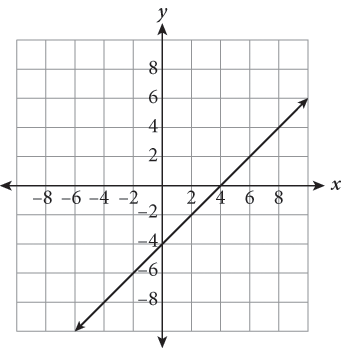
Suppose you’re asked to find the value of x for which f(x) = 6. Because f(x) represents the output value, or range, translate this as “When does the y value equal 6?” To answer the question, find 6 on the y-axis, then trace over to the function (the line). Read the corresponding x value: it’s −2, so when f(x) = 6, x must be −2.
The PSAT might also present functions in the form of tables. These may or may not have an equation associated with them, but regardless, you’ll need to be adept at extracting the information necessary to answer questions. Most of the time the table will have just two columns, one for the domain and another for the range.
Note
Remember: A value of f(x) corresponds to a location along the y-axis. A value of x corresponds to a location on the x-axis.
Now let’s try a test-like example:
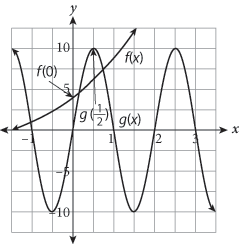
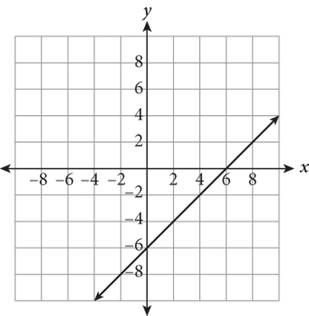
2. 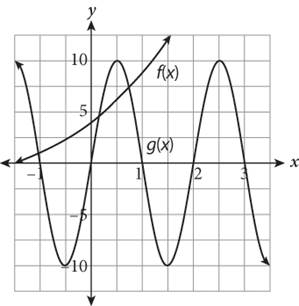
In the figure shown, what is the value of ![]() ?
?
1. −4
2. 6
3. 10
4. 14
Work through the Kaplan Method for Math step-by-step to solve this question. The following table shows Kaplan’s strategic thinking on the left, along with suggested math scratchwork on the right.
|
Strategic Thinking |
Math Scratchwork |
|
Step 1: Read the question, identifying and organizing important information as you go You’re asked to determine the value of |
|
|
Step 2: Choose the best strategy to answer the question How can you find f(0)? Start with f (x). Locate the spot on the graph of f (x) where x = 0. At that point, the y-value is 4. Therefore, f (0) = 4. What about g( Repeat the previous process for g(x) when The hard part is over; now just add the values together. |
|
|
Step 3: Check that you answered the right question You found |
f (0) + g( |
Note
Watch your axis scales; just like scatterplot questions, questions involving graphs of functions often contain trap answers for students who misread the axes.
Although this question would have been much simpler if the graph had labeled the points or given you an equation to plug values into, it wouldn’t have tested your knowledge of functions. Your ability to figure out what questions about functions are actually asking is key to solving them correctly on Test Day.
Try out a question in which a function is presented in the form of a table:
3.
|
Game |
Number of students |
|
1 |
5 |
|
2 |
11 |
|
3 |
21 |
|
4 |
35 |
|
5 |
53 |
|
6 |
75 |
|
7 |
101 |
|
8 |
131 |
4. West Valley High School is keeping track of how many students show up to the home football games wearing face paint in the school colors. To encourage participation, there is a prize giveaway at each game. As the prizes get more exciting, participation begins to increase. If j represents the game number and f(j) represents the number of students in face paint at game j, which of the following functions best describes the information in the table?
1. ![]()
2. ![]()
3. ![]()
4. ![]()
Work through the Kaplan Method for Math step-by-step to solve this question. The following table shows Kaplan’s strategic thinking on the left, along with suggested math scratchwork on the right.
|
Strategic Thinking |
Math Scratchwork |
|
Step 1: Read the question, identifying and organizing important information as you go The question is asking which function accurately depicts the relationship between the game number and how many students show up in face paint. |
|
|
Step 2: Choose the best strategy to answer the question The question stem tells you what f and j represent and provides a table relating the two variables. |
f = number of students j = the game number |
|
Can you eliminate any obviously incorrect answers right away? Choices A and B are linear functions. Because the number of students does not increase by a constant amount, we can safely eliminate these choices. |
|
|
How can you best evaluate the remaining answer choices? Try plugging a pair of data points from the table into the remaining choices. The point (8, 131) invalidates C, so eliminate it. |
use (8, 131) C: 131 = 131 = 131 = 32 + 7 131 ≠ 39 |
|
There’s only one answer choice left. Am I done? You know (D) must be correct, but plug in (8, 131) to confirm. |
D: 131 = 2 x 82 + 3 131 = 2 x 64 + 3 131 = 128 + 3 131 = 131 |
|
Step 3: Check that you answered the right question The only function that fits all the entries in the table is (D). |
Note
When you have only one answer choice remaining, it isn’t necessary to evaluate it. If you’ve done your math correctly up until that point, you know the remaining answer choice has to be correct. However, if you’re at all worried that you made a mistake earlier, check the remaining answer choice to validate your math.
REAL-WORLD APPLICATION OF FUNCTIONS
Because functions are equations, you have a great deal of flexibility in working with them. For example, order of operations (PEMDAS) and the basic rules of algebra apply to functions just as they do to equations. You learned in Unit 1 that equations can represent real-world situations in convenient ways, and the same is true for functions.
For example, suppose a homeowner wants to determine the cost of installing a certain amount of carpet in her living room. In prose, this would quickly become awkward to handle, as a description would need to account for the cost per square foot, fixed installation fee, and sales tax to get the final cost. However, you can easily express this as a function.
Suppose that, in the homeowner example, carpet costs $0.86 per square foot, the installer charges a $29 installation fee, and sales tax on the total cost is 7%. Using your algebra and function knowledge, you can describe this situation in which the cost, c, is a function of square footage, f . The equation would be c = 1.07(0.86f + 29). In function notation, this becomes c(f ) = 1.07(0.86f + 29), where c(f ) is shorthand for “cost as a function of square footage.” The following table summarizes what each piece of the function represents in the scenario:
|
English |
Overall cost |
Square footage |
Material cost |
Installation fee |
Sales tax |
|
Math |
c |
f |
0.86 f |
29 |
1.07 |
Note
Why does a 7% tax translate to 1.07? Using 0.07 would only provide the sales tax due. Because the function is meant to express the total cost, 1.07 is used to retain the carpet cost and installation fee while introducing the sales tax. Think of it as 100% (the original price) + the 7% sales tax on top. In decimal form, 1 + 0.07 = 1.07.
This test-like question will test your ability to write a function and use it to solve a problem:
4. A country club allows its members to host private parties. The price is a function of a number of variables. First, members are charged a fixed fee of $1,000 during the peak season (spring, summer, fall) and $500 during the winter months. Members must also pay a certain additional amount for each attendee: $150 per guest in the peak season and $120 per guest in the winter. An administrative fee of 20% of the headcount cost is added to account for logistics, and a 6% sales tax is added to the final bill. How much would a member save by holding a party for 85 guests in winter instead of spring? Round your answer to the nearest dollar.
A word problem like this is a great time to reach for the Kaplan Strategy for Translating English into Math. The following table shows Kaplan’s strategic thinking on the left, along with suggested math scratchwork on the right.
|
Strategic Thinking |
Math Scratchwork |
|
Step 1: Read the question, identifying and organizing important information as you go You’re asked to find the difference in cost between a winter and spring party for 85 people. |
|
|
Step 2: Choose the best strategy to answer the question How do you sort through all the words? Use the Kaplan Strategy for Translating English into Math to extract what you need. What variables need to be defined? You have a cost, c, which is a function of guests, g, in attendance outside the winter months. In winter the cost is w, which is also a function of guests. What other information is provided? The question provides several numbers; break it apart to get each numerical piece by itself. What math pieces can I get from the small phrases? |
c = cost of party (peak) $150 per guest (peak) 20% admin. cost on headcount |
|
Examine the question carefully to ensure the right figures are being combined. This is an easy place to inadvertently switch a peak season figure with one from winter. What function represents the total cost during the peak season? Put the pieces together to get your function. Remember to add 1 onto your percents so you’re calculating the total cost and not the administrative charge or tax alone. Repeat the same process for the winter season, but make sure not to confuse any quantities. How much will the party for 85 people cost in spring? Plug 85 into the appropriate function. How much would the same party cost in the winter? Plug 85 into the appropriate function. How can you find the amount of savings? Subtract the winter costs from peak costs. |
fixed fees: 1,000 (peak), 500 (winter) c(g) = 1.06(1.2(150g) + 1,000) w(g) = 1.06(1.2(120g) + 500) c(85) = 190.8 x 85 + 1060 w(85) = 152.64 x 85 + 530 c(85) — w(85) = 3,773.6 |
|
Step 3: Check that you answered the right question Round your answer to the nearest dollar. |
|
Note
On Test Day, it would take considerable time to write out everything in this scratchwork column verbatim; use good judgment when doing scratchwork, and abbreviate when you can. For clarity, we’ve included more than the average student would write.
Notice that even with a more difficult word problem, the Kaplan Strategy for Translating English into Math gets the job done. You also should have noticed how function notation can help keep your scratchwork clear and organized.
MULTIPLE FUNCTIONS
There are several ways in which the PSAT might ask you to juggle multiple functions simultaneously. Fortunately, the rules governing what to do are easy to understand. To start, we’ll look at how to combine functions. This technique simply involves adding, subtracting, multiplying, and/or dividing the functions in play. Check out the following table for a synopsis of how to combine functions with the four basic operations (and how to make them look less intimidating):
|
When you see … |
convert it to… |
|
(f + g)(x) |
f(x) + g(x) |
|
(f − g)(x) |
f(x) − g(x) |
|
(fg)(x) |
f(x) × g(x) |
|
|
|
You’ll have a chance to solve a problem involving combined functions shortly.
A more challenging type of function question that you’re likely to see is a composition of functions or nested functions. Questions involving a composition of functions require that you find an output value for one function and use the result as the input for another function to get the final solution. A composition of functions can be written as f(g(x)) or ![]() . The first is read as f of g of x, and the second, f composed with g of x. To answer these questions, start with the innermost parentheses and work your way out.
. The first is read as f of g of x, and the second, f composed with g of x. To answer these questions, start with the innermost parentheses and work your way out.
Note
You might see a composition of functions written as ![]() . Just remember that it’s the same as f(g(x)), and solve as you would normally, working from the inside outward.
. Just remember that it’s the same as f(g(x)), and solve as you would normally, working from the inside outward.
Suppose f(x) = 8x and g(x) = x + 3. To find the value of f (g(1)), your steps would be as follows:
1. Determine g(1), the innermost function when x = 1.
2. By substituting 1 for x in g(x), you find that g(1) = 1 + 3 = 4. Now rewrite f (g(1)) as f (4).
3. Find f (4), the outer function when x = 4. Substituting 4 for x in function f, the final answer is 8(4) = 32.
Note
Note that f (g(x)) does not equal g(f (x)). Not only is interchanging these incorrect, but this practice might also lead to a trap answer on Test Day.
On Test Day, you might see piecewise functions. A piecewise function is a function that is defined, literally, by multiple pieces. What breaks a function into pieces are different rules that govern different parts of the function’s domain. Here’s an example:
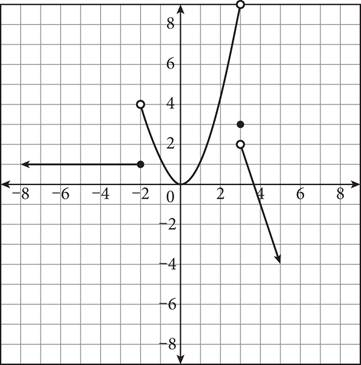

In the function shown, the behavior of the graph depends on the domain. Linear, quadratic, and even a single-point interval make up this function. Each “rule” is written inside the open bracket in “pieces.” To the right is the domain interval for which each “rule” applies. On the graph, an open dot indicates that a point is not included in the interval; a closed dot indicates one that is. Note that the different inequality signs used in the domain constraints dictate whether a dot is open or closed on the graph. For a single-point interval, an equal sign is used.
To evaluate a piecewise function, first determine to which piece of the domain the input value belongs, and then substitute the value into the corresponding rule. For example, in the function above, f(2) = (2)2 = 4, because the input value 2 is between —2 and 3 (the second piece of the domain). Similarly, f(5) = —3(5) + 11 = — 4 because the input value 5 is greater than 3 (the last piece of the domain). You can confirm these values by looking at the graph. At x = 2, the point on the graph is (2, 4), and at x = 5, the point on the graph is (5, — 4).
Give this function question a try:
5. Given that ![]() and
and ![]() , what is the value of (fg)(—5) ?
, what is the value of (fg)(—5) ?
1. −6
2. −2
3. 3
4. 9
Appearances can be deceiving. At first glance, this question looks tough, but the following table will clarify anything confusing. Kaplan’s strategic thinking is on the left, along with suggested math scratchwork on the right.
|
Strategic Thinking |
Math Scratchwork |
|
Step 1: Read the question, identifying and organizing important information as you go Read carefully to see what the question is asking. You need to find the product (fg) of the results when each function is evaluated at x = —5. |
|
|
Step 2: Choose the best strategy to answer the question You could multiply the two functions together and then evaluate the result, but it’s quicker to evaluate each function separately and then multiply. |
|
|
Step 3: Check that you answered the right question The question is asking for the product (fg), which is 9, (D). |
(f g )(—5) = —9 × (—1) = 9 |


Let’s look at a sample test-like question involving a composition of functions:
6. If ![]() and
and ![]() , where x ≠ −1, what is the value of
, where x ≠ −1, what is the value of ![]() ?
?
1. ![]()
2. ![]()
3. ![]()
4. ![]()
Use the Kaplan Method for Math to solve this question, working through it step-by-step. The following table shows Kaplan’s strategic thinking on the left, along with suggested math scratchwork on the right.
|
Strategic Thinking |
Math Scratchwork |
|
Step 1: Read the question, identifying and organizing important information as you go The question is asking for the value of g(f (3)). |
|
|
Step 2: Choose the best strategy to answer the question You have a composition of functions, so start with the innermost set of parentheses. Substitute 3 for x in f (x). Next, simplify using order of operations until you get a single value for f (3). |
|
|
How do you use f(3) to solve for g(f(3))? You know f (3) = 26, so substitute 26 wherever you see f (3) to yield g(26). In other words, plug in the first “output” as the new “input” of the second function. The answer choices do not include Both 78 and 27 are multiples of 3, so you can reduce to |
|
|
Step 3: Check that you answered the right question The fraction |


DESCRIBING FUNCTION BEHAVIOR AND PERFORMING TRANSFORMATIONS
When describing the graph of a function or an interval (a specific segment) of a function, the trend of the relationship between the x- and y- values while reading the graph from left to right is often important. Three terms you are sure to see in more difficult function questions are increasing, decreasing, and constant. Let’s look at what these terms mean and how they apply to PSAT questions:
· Increasing functions have y-values that increase as the corresponding x-values increase.
· Decreasing functions have y-values that decrease as the corresponding x-values increase.
· Constant functions have y-values that stay the same as the x-values increase.
The PSAT can ask about function trends in a variety of ways. The most basic would be to examine a function’s behavior and determine whether (and where) the function is increasing, decreasing, or constant. Tougher questions might ask you to identify the trend and then explain what it means in the context of a real-life situation presented in the question, or to identify the effect a transformation would have on the trend of a function.
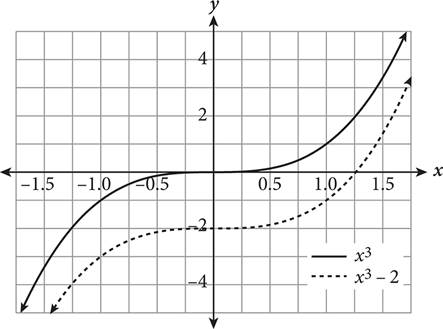
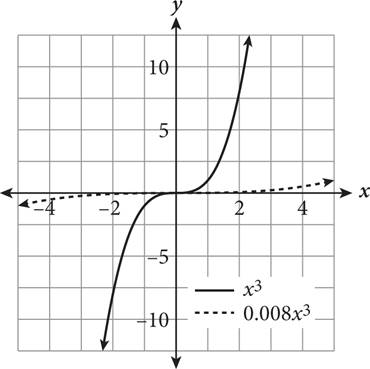
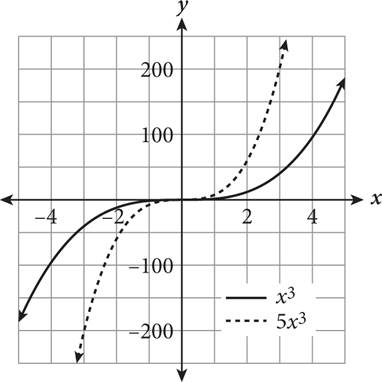
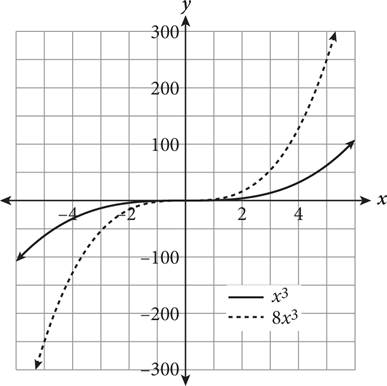
A function transformation occurs when a change is made to the function’s equation or graph. Transformations include translations (moving a graph up/down, left/right), reflections (flips about an axis or other line), and expansions/compressions (stretching or squashing horizontally or vertically). How do you know which is occurring? The following table provides some rules for guidance when altering a hypothetical function f(x).
|
Algebraic Change |
Corresponding Graphical Change |
Graph |
Algebraic Change |
Corresponding Graphical Change |
Graph |
|
f(x) |
N/A—original function |
|
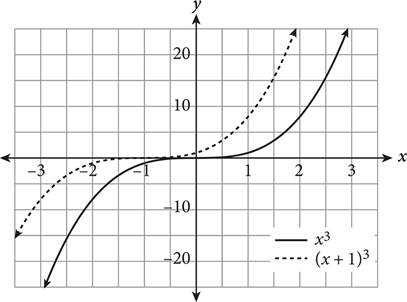
f(x + a) |
f(x) moves left a units |
|
|
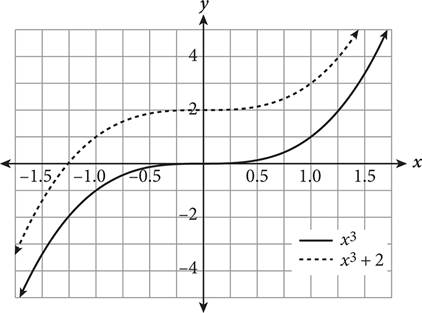
f(x) + a |
f(x) moves up a units |
|
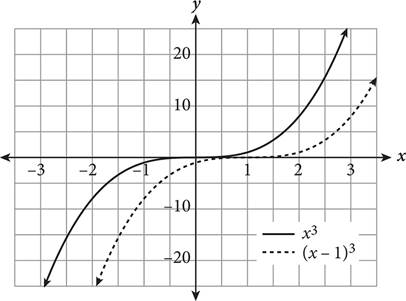
f(x − a) |
f(x) moves right a units |
|
|
f(x) − a |
f(x) moves down a units |
|
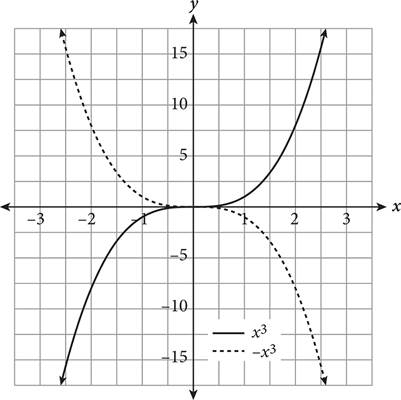
− f(x) |
f (x) reflected over the x-axis (top to bottom) |
|
|
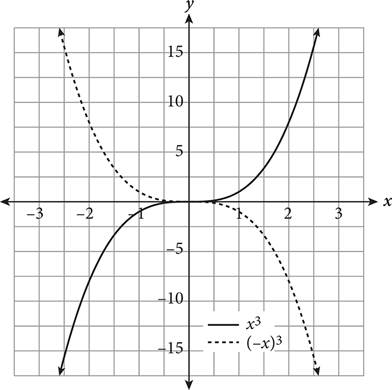
f(−x) |
f(x) reflected over the y-axis (left to right) |
|
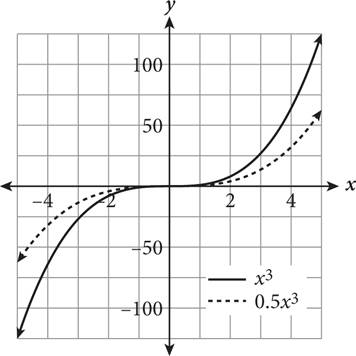
af(x) (0 < a < 1) |
f (x) undergoes vertical compression |
|
|
f(ax) (0 < a < 1) |
f(x) undergoes horizontal expansion |
|
af(x) |
f (x) undergoes vertical expansion |
|
|
f(ax) |
f(x) undergoes horizontal compression |
|
|||
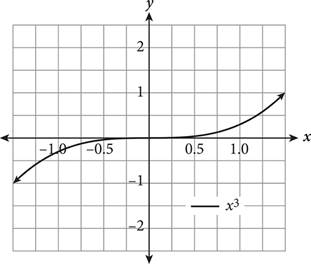
If you forget what a particular transformation looks like, you can always plug in a few values for x and plot the points to determine the effect on the function’s graph.
Expert Tip
Adding or subtracting inside the parentheses of a function will always cause a horizontal change (e.g., shift left/right, horizontal reflection); if the alteration is outside the parentheses, the result is a vertical change.
Try out this function transformation question:
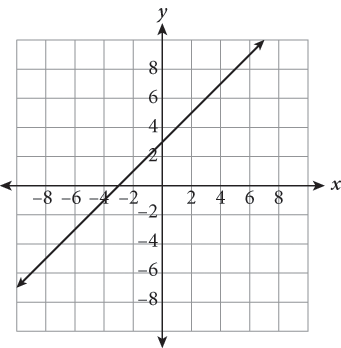
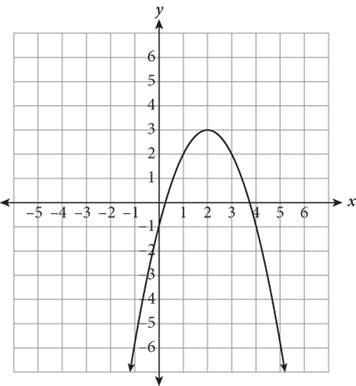
7. 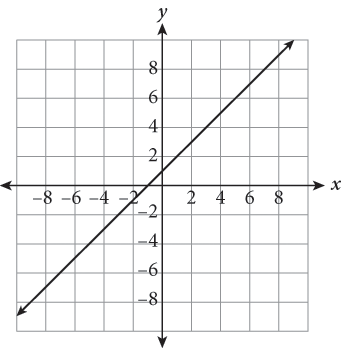
The graph above represents the function f (x). Which of the following choices corresponds to ![]() ?
?
1. 
2. 
3. 
4. 
Note
Note that the slope of the function post-translation is identical to that of the original function. Translations only shift a function and do not impact slope.
Use the Kaplan Method for Math to solve this question, working through it step-by-step. The following table shows Kaplan’s strategic thinking on the left, along with suggested math scratchwork on the right.
|
Strategic Thinking |
Math Scratchwork |
|
Step 1: Read the question, identifying and organizing important information as you go You must determine which graph shows the transformation specified in the question stem. |
|
|
Step 2: Choose the best strategy to answer the question How do you begin solving? First, determine what the transformation is. Next, identify a couple of easy points on the initial function and apply the transformation “instructions” to them. The y-intercept is a good choice here. On which graph do the transformed points lie? Determine which answer’s graph contains the new coordinates. |
graph moves 2 units right and 5 units down (0, 1) becomes (2, −4) (1, 2) becomes (3, −3) new points fall on the graph of (B) |
|
Step 3: Check that you answered the right question The only matching graph is (B). |
Expert Tip
If you’re better with algebra, plug the transformation changes into the original function instead of picking points. Substituting x − 2 for x and subtracting another 5 gives y = [(x − 2) + 1] − 5 = x − 6. The graph of y = x − 6 clearly corresponds to (B).
Practice
Now you’ll have a chance to try a couple test-like questions in a scaffolded way. We’ve provided some guidance, but you’ll need to fill in the missing parts of explanations or the step-by-step math in order to get to the correct answer. Don’t worry—after going through the worked examples at the beginning of this section, these questions should be completely doable.
8. Scientists are modeling population trends and have noticed that when a certain bacterial population changes, the change is based on a linear function of the amount of time elapsed in seconds. When t = 21 seconds, the population is 8 colonies, and when t = 35 seconds, the population is 10 colonies. Which of the following best describes f (t) ?
1. ![]()
2. ![]()
3. ![]()
4. ![]()
The following table can help you structure your thinking as you go about answering this question. Kaplan’s strategic thinking is provided, as are bits of structured scratchwork. If you’re not sure how to approach a question like this, start at the top and work your way down.
|
Strategic Thinking |
Math Scratchwork |
|
Step 1: Read the question, identifying and organizing important information as you go You need to find the function that describes the population increase observed. |
f (t) = ? |
|
Step 2: Choose the best strategy to answer the question What form do all the functions take? What is different about each one? All the answer choices are linear functions, and the slope is different for each one. To use the slope formula, what do you need? You need two ordered pairs to plug into the formula. Use the information provided to write two ordered pairs in the form (time, number of colonies). Then calculate the slope. |
|
|
Step 3: Check that you answered the right question If you picked (C), you were right! You can check by plugging one or both of your points into this equation. |
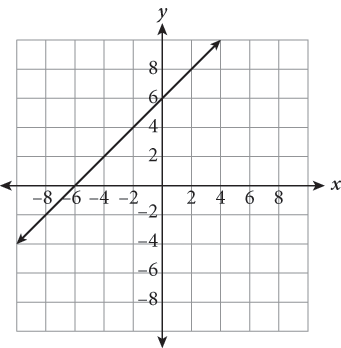
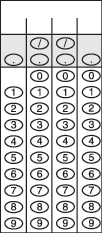
9. 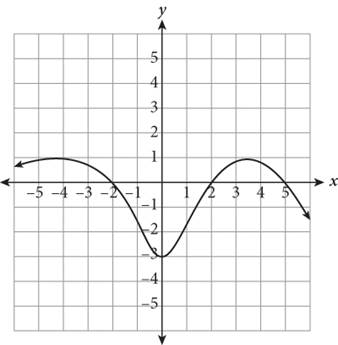
The figure shows the graph of r(x). What is one value of x for which r(x) = 0 ?
The following table can help you structure your thinking as you go about solving this problem. Kaplan’s strategic thinking is provided, as are bits of structured scratchwork.
|
Strategic Thinking |
Math Scratchwork |
|
Step 1: Read the question, identifying and organizing important information as you go You need to find a value of x for which r(x) = 0. |
r (x) = 0 at x = ? |
|
Step 2: Choose the best strategy to answer the question What information does the question provide? What does “r(x) = 0” mean graphically? You have a graph of the function r(x); you must determine where y = 0 for the function r(x). |
when r (x) = 0, y = ____ when y = 0, x = ____ , ____ , ____ |
|
Step 3: Check that you answered the right question Did you get −2, 2, and 5? If so, you’re right! Because Grid-in answers can only be positive, choose either 2 or 5. Either answer is correct. |
Perform
Now that you’ve seen the variety of ways in which the PSAT can test you on functions, try the following questions to check your understanding. Give yourself 4.5 minutes to tackle the following three questions. Make sure you use the Kaplan Method for Math as often as you can. Remember, you want to emphasize speed and efficiency in addition to simply getting the correct answer.
10.For the two functions f (x) and g(x), tables of values follow. What is the value of f (g(1)) ?
|
x |
f(x) |
|
−2 |
8 |
|
−1 |
6 |
|
0 |
4 |
|
1 |
2 |
|
x |
g(x) |
|
−1 |
−4 |
|
1 |
0 |
|
2 |
2 |
|
4 |
6 |
1. 0
2. 2
3. 4
4. 6
11.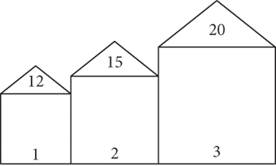
A construction company plans to build a long row of houses, each with a certain number of brown shingles on its roof. The number of brown shingles on a house’s roof, f (h), is a function of its house number, h. The first few houses are shown here. If only brown shingles are used, how many shingles will the seventh house have?
1. 7
2. 27
3. 46
4. 60
12.
The function ![]() is shown here. Which of the following correctly depicts the transformation g(x) = (—x+2)2+3? ?
is shown here. Which of the following correctly depicts the transformation g(x) = (—x+2)2+3? ?
1. 
2. 
3. 
4. 
On your own
1. An ecosystem is a network in which all living and nonliving things are connected. Components of an ecosystem are interdependent, meaning that a change in one component affects all other elements of the ecosystem. Biologists often study changes in ecosystems to predict other changes. A biologist studying the birth rate of a certain fish uses the function b(n) to analyze the fish’s effect on other parts of the ecosystem, where n is the number of eggs laid by the fish over a given period of time. Which of the following lists could represent a portion of the domain for the biologist’s function?
1. {… —1,500, —1,000, —500, 0, 500, 1,000, 1,500…}
2. {—1,500, —1,000, —500, 0, 500, 1,000, 1,500}
3. {0, 0.25, 0.5, 0.75, 1, 1.25, 1.5…}
4. {0, 500, 1,000, 1,500, 2,000…}
2. If h(x) = 3x — 1, what is the value of h(5) — h(2) ?
1. 3
2. 8
3. 9
4. 14
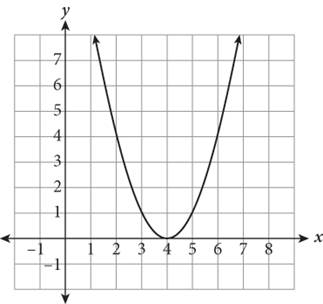
3. 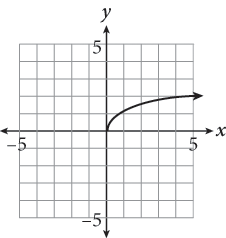
The figure shown represents the function ![]() . Which statement about the function is not true?
. Which statement about the function is not true?
1. q(0) = 0
2. q(2) = 4
3. The range of q(x) is y ≥ 0.
4. The domain of q(x) is x ≥ 0.
4. A function is defined by the equation ![]() . For what value of x does f (x) = 5 ?
. For what value of x does f (x) = 5 ?
1. —5
2. 2
3. 9
4. 30
5. 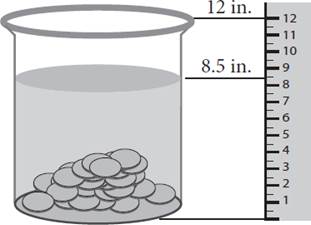
Tyree is dropping old pennies into a jar that contains a cleaning solution. As he adds more pennies, the height of the solution in the jar changes based on the number of pennies he adds. The figure shows this relationship after 50 pennies have been dropped in the jar. If the height of the solution in the jar was 5 inches before any pennies were added, which of the following linear functions represents the relationship between the number of pennies and the height of the solution in the jar?
1. h(p) = 0.7p + 5
2. h(p) = 0.7p + 8.5
3. h(p) = 0.07p + 5
4. h(p) = 0.07p + 8.5
6.
|
x |
g(x) |
|
−2 |
1 |
|
0 |
2 |
|
1 |
3 |
|
4 |
2 |
|
6 |
1 |
|
x |
h(i) |
|
−2 |
4 |
|
−1 |
2 |
|
0 |
0 |
|
1 |
−2 |
|
2 |
− 4 |
7. Several values for the functions g(x) and h(x) are shown in the tables. What is the value of g(h(—2)) ?
1. —2
2. 0
3. 2
4. 3
7. If the graph of R(x) passes through the point (—2, 6), through which point does the graph of —R(x + 5) + 1 pass?
1. (—7, —5)
2. (3, —5)
3. (3, 7)
4. (7, 7)
8. ![]()
Doctors use the function shown to calculate the concentration, in parts per million, of a certain drug in a patient’s bloodstream after t hours. How many more parts per million of the drug are in the bloodstream after 20 hours than after 10 hours?
9. Which set of ordered pairs could represent part of a function?
1. {(—4, —4), (—2, —2), (0, 0), (—2, 2), (—4, 4)}
2. {(—4, —2), (—2, 0), (0, 2), (2, 0), (4, —2)}
3. {(—2, 0), (0, —2), (2, 0), (0, 2), (4, 2)}
4. {(—2, —4), (—2, —2), (—2, 0), (—2, 2), (—2, 4)}
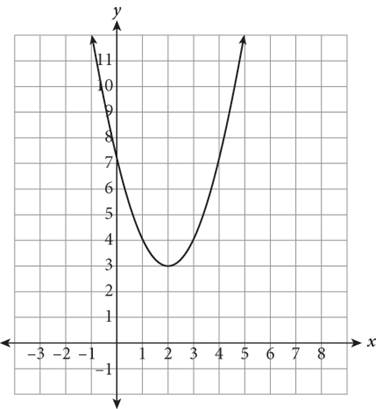
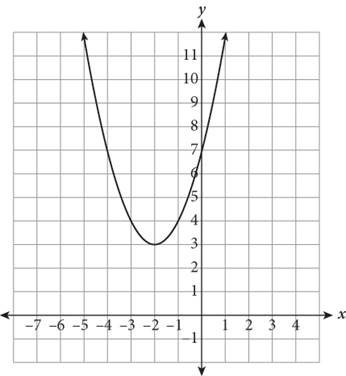
10.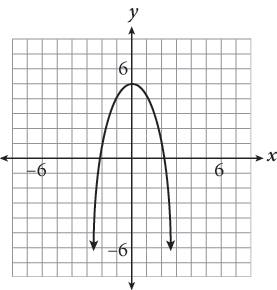
The graph of f (x) is shown here. Which of the following represents the domain and range of the function?
1. Domain: f (x) ≥ 5; range: all real numbers
2. Domain: f (x) ≤ 5; range: all real numbers
3. Domain: all real numbers; range: f (x) ≥ 5
4. Domain: all real numbers; range: f (x) ≤ 5
11.If ![]() , which of the following statements is always true?
, which of the following statements is always true?
1. g(x) < 0
2. g(x) > 0
3. g(x) < 0 when x < 0
4. g(x) > 0 when x > 0
12.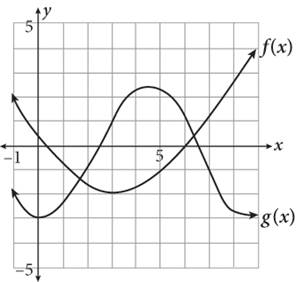
In the figure shown, what is the value of f (3) — g(3) ?
1. —3
2. 0
3. 3
4. 6
13.If f (x) = − 4x + 1 and ![]() , what is the value of
, what is the value of ![]() ?
?
1. —11
2. 0
3. 2.5
4. 3
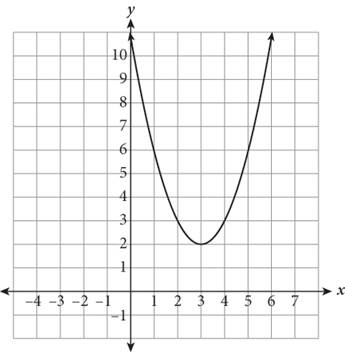
14.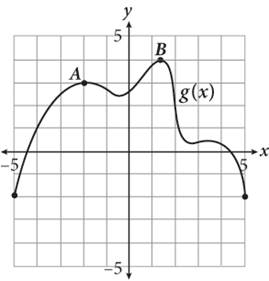
The graph of g(x) is shown in the figure. If k(x) = —g(x) — 1, which of the following statements is true?
1. The range of k(x) is —5 ≤ y ≤ 1.
2. The minimum value of k(x) is —4.
3. The coordinates of point A on the function k(x) are (2, 0).
4. The graph of k(x) is increasing between x = 0 and x = 1.
15.If f (x) = —x + 5 and g(x) = x 2, which of the following is not in the range of f (g(x)) ?
1. —11
2. 0
3. 1
4. 9