PSAT/NMSQT Prep 2022 - Eggert M.D., Strelka A. 2022
How much have you learned?
Tables, statistics, and probability
Data analysis
Directions: For testlike practice, give yourself 15 minutes to complete this question set. Be sure to study the explanations, even for questions you got right. They can be found at the end of this chapter.
Questions 24 and 25 refer to the following information.
The table below shows the distribution of applicants by age and level of education for a management trainee program offered at a retail store.
|
Age Group |
High School Diploma Only |
2-Year Degree |
4-Year Degree |
Total |
18—25 |
23 |
12 |
3 |
38 |
26—35 |
16 |
19 |
9 |
44 |
36—45 |
11 |
13 |
2 |
26 |
Older than 45 |
2 |
2 |
0 |
4 |
Total |
52 |
46 |
14 |
112 |
24. ![]() According to the data, which age group had the smallest percentage of people with a high school diploma only?
According to the data, which age group had the smallest percentage of people with a high school diploma only?
A. 18—25
B.26—35
C.36—45
D. Older than 45
25. ![]() Based on the table, if a single applicant is selected at random from all the applicants, what is the probability that he or she will have a 2-year degree and be at least 26 years old?
Based on the table, if a single applicant is selected at random from all the applicants, what is the probability that he or she will have a 2-year degree and be at least 26 years old?
A. ![]()
B.![]()
C.![]()
D. ![]()
Questions 26 and 27 refer to the following information.
The Kp Index measures the energy added to Earth’s magnetic field from the Sun on a scale of 0—9, with 1 representing a solar calm and 5 or more indicating a magnetic storm, or solar flare. The magnetic fluctuations are measured in three-hour intervals (12 a.m.—3 a.m., 3 a.m.—6 a.m., and so on). The bar graph below shows the measurements for a five-day period in September.
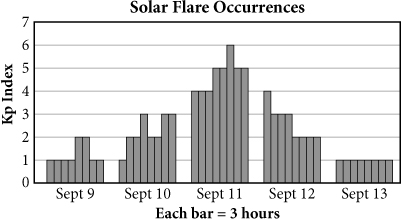
26. Based on the graph, a solar flare lasted for how many hours on September 11?
27. If a single 3-hour time period between September 9 and September 13 (including the start and end dates) is chosen at random, what is the probability that a solar flare occurred during that time?
Questions 28 and 29 refer to the following information.
Most cinemas have multiple movie theaters, each running a variety of movies all day. The following table shows the daily costs associated with keeping each theater open.
|
Expense per Theater |
Amount |
Electricity |
$150/day |
Trash Disposal and Cleaning |
$80/day |
Operational Staff |
$11/hour |
28. Cinema XV has 15 movie theaters, each of which averages 600 customers per day. If the cinema closes 6 of the theaters during the winter months but total theater attendance stays the same, what is the average daily attendance per theater among the remaining theaters?
29. If each theater requires one operational staff member for 14 hours, how much money does Cinema XV save per day during the winter months by closing six theaters?
Questions 30 and 31 refer to the following information.
The following table shows the number of babies born in a certain hospital in October 2018. The table categorizes the births by whether the mother participated in a new prenatal program and whether the baby was below, above, or within the healthy weight range as defined by the World Health Organization.
|
Below Range |
Within Range |
Above Range |
Total |
|
Participant |
1 |
55 |
10 |
66 |
Not a Participant |
8 |
49 |
5 |
62 |
Total |
9 |
104 |
15 |
128 |
30. ![]() The at-risk group is defined as all babies above or below the healthy weight range. What percent of the babies born at this hospital in October 2018 were considered at-risk? Round your answer to the nearest whole number and ignore the percent sign when gridding your response.
The at-risk group is defined as all babies above or below the healthy weight range. What percent of the babies born at this hospital in October 2018 were considered at-risk? Round your answer to the nearest whole number and ignore the percent sign when gridding your response.
31. ![]() The hospital decides to focus its study on the two at-risk groups with the highest number of babies: Not a Participant/Below Range and Participant/Above Range. If a baby is randomly selected from all those born at this hospital in October 2018, what is the probability that the baby belongs to one of those two groups?
The hospital decides to focus its study on the two at-risk groups with the highest number of babies: Not a Participant/Below Range and Participant/Above Range. If a baby is randomly selected from all those born at this hospital in October 2018, what is the probability that the baby belongs to one of those two groups?
Questions 32 and 33 refer to the following information.
A team of researchers studied the effect of sleep masks on rapid eye movement (REM) sleep. Study participants were divided into three groups: the first group did not wear sleep masks, the second group wore regular sleep masks, and the third group wore sleep masks that were contoured away from the eyes and lashes. The results of the study are shown in the following table.
|
No Mask |
Regular Mask |
Contoured Mask |
Total |
|
Experienced REM Sleep |
14 |
33 |
78 |
125 |
Did Not Experience REM Sleep |
34 |
29 |
22 |
85 |
Total |
48 |
62 |
100 |
210 |
32. ![]() What percent of the participants who experienced REM sleep during the study wore a contoured mask?
What percent of the participants who experienced REM sleep during the study wore a contoured mask?
A. 37.1%
B.47.6%
C.59.5%
D. 62.4%
33. ![]() Based on the results of this study, if a company sold 12,000 of the contoured sleep masks, about how many of the consumers should experience REM sleep using the mask, assuming the participants in the study were a good representative sample?
Based on the results of this study, if a company sold 12,000 of the contoured sleep masks, about how many of the consumers should experience REM sleep using the mask, assuming the participants in the study were a good representative sample?
A. 4,457
B.5,714
C.7,488
D. 9,360