PSAT/NMSQT Prep 2022 - Eggert M.D., Strelka A. 2022
How much do you know?
Functions
Passport to advanced math
LEARNING OBJECTIVES
After completing this chapter, you will be able to:
· Apply function notation
· Define the domain and range of a function
· Evaluate the output of a function for a given input
· Identify the correct graph of a function
· Write a function to describe a rule or data set
105/600 SmartPoints® (Very High Yield)
How much do you know?
Directions: Try the questions that follow. Show your work so that you can compare your solutions to the ones found in the Check Your Work section immediately after this question set. The “Category” heading in the explanation for each question gives the title of the lesson that covers how to solve it. If you answered the question(s) for a given lesson correctly, and if your scratchwork looks like ours, you may be able to move quickly through that lesson. If you answered incorrectly or used a different approach, you may want to take your time on that lesson.
1. Given that ![]() and
and ![]() , what is the product of f (−5) and g (−5)?
, what is the product of f (−5) and g (−5)?
A. −6
B.−2
C.3
D. 9
2. For the two functions f(x) and g (x), tables of values follow. What is the value of f (g(1))?
|
x |
f(x) |
−2 |
8 |
−1 |
6 |
0 |
4 |
1 |
2 |
|
x |
g(x) |
−1 |
−4 |
1 |
0 |
2 |
2 |
4 |
6 |
A. 0
B.2
C.4
D. 6
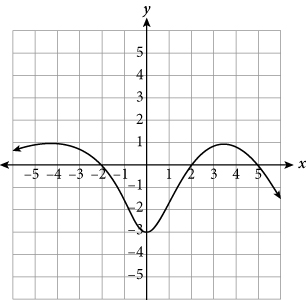
4. The figure shows the graph of r(x). What is one value of x for which r(x) = 0?
|
Game |
Number of Students |
1 |
5 |
2 |
11 |
3 |
21 |
4 |
35 |
5 |
53 |
6 |
75 |
7 |
101 |
8 |
131 |
5. West Valley High School is encouraging students to wear school colors when they attend the home football games by giving a prize to one of the students who does so. The school finds that, as the prizes get more exciting, participation begins to increase. If j represents the game number and f (j) represents the number of students in school colors at game j, which of the following functions best describes the information in the table?
A. ![]()
B.![]()
C.![]()
D. ![]()
6. Scientists are modeling population trends and have noticed that when a certain bacterial population changes, the change is based on a linear function of the amount of time elapsed in hours. When t = 21 hours, the population is 8 colonies, and when t = 35 hours, the population is 10 colonies. Which of the following best describes f (t)?
A. ![]()
B.![]()
C.![]()
D. ![]()
Check Your Work
1. D
Difficulty: Easy
Category: Function Notation
Getting to the Answer: Read carefully to see what the question is asking. You need to find the product (fg) of the results when you evaluate each function at x = −5. You could multiply the two functions together and then evaluate the result, but it’s quicker to evaluate each function and then multiply:
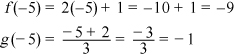
Now, multiply to get (−9)(−1) = 9, which is (D).
2. C
Difficulty: Easy
Category: Function Notation
Getting to the Answer: This is a composition of functions, so start with the innermost set of parentheses, which is g(1). According to the g(x) table, when x = 1, g(x) = 0. Then, x = 0 becomes the input for f. Now, find f (0); the f(x) table shows this is equal to 4, which is (C).
3. 2 or 5
Difficulty: Easy
Category: Graphs of Functions
Getting to the Answer: The notation r(x) = 0 means that the function is crossing the x-axis (has a y-value of 0), so look for the x-intercepts. The function r(x) intersects the x-axis at x = −2, 2, and 5. Only positive values are allowed in Grid-in questions, so use 2 or 5.
4. D
Difficulty: Easy
Category: Describing Real-Life Situations with Functions
Getting to the Answer: You’re given two variables, j and f, which represent the game number and the number of students wearing school colors, respectively. From the data, you can see the rate of change in the number of students is not constant (not linear), so eliminate (A) and (B). Next, try plugging a point toward the bottom of the table into (C) and (D):
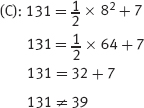
Only (D) is left and is correct. For the record:
5. C
Difficulty: Medium
Category: Describing Real-Life Situations with Functions
Getting to the Answer: Because the slopes of all the answer choices are different, you can use the slope formula to determine which choice is correct. The number of colonies depends on the time elapsed, so start by writing the information given as ordered pairs in the form (time, number of colonies). Using the ordered pairs (21, 8) and (35, 10), the slope is ![]() .
.
The only choice with this slope is (C).