PSAT/NMSQT Prep 2020 - Princeton Review 2020
Prerequisite skills and calculator use
Psat math
Learning Objectives
After completing this chapter, you will be able to:
· Identify skills necessary to obtain the full benefits of the Math sections of this book
· Use efficiency tips to boost your test-day speed
· Distinguish between questions that need a calculator and questions in which manual calculations are more efficient
Math Fundamentals
Learning Objectives
After this lesson, you will be able to:
· Identify skills necessary to obtain the full benefits of the Math sections of this book
· Use efficiency tips to boost your test-day speed
TEST PREREQUISITES
This book focuses on the skills that are tested on the PSAT. It assumes a working knowledge of arithmetic, algebra, and geometry. Before you dive into the subsequent chapters where you’ll try test-like questions, there are a number of concepts—ranging from basic arithmetic to geometry—that you should master. The following sections contain a brief review of these concepts.
Algebra and Arithmetic
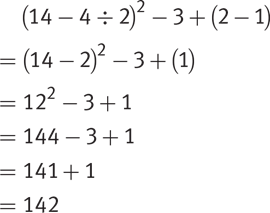
· Order of operations is one of the most fundamental of all arithmetic rules. A well-known mnemonic device for remembering this order is PEMDAS: Please Excuse My Dear Aunt Sally. This translates to Parentheses, Exponents, Multiplication/Division, Addition/Subtraction. Perform multiplication and division from left to right (even if it means division before multiplication) and treat addition and subtraction the same way, as shown here:
· Three basic properties of number (and variable) manipulation—commutative, associative, and distributive—will assist you with algebra on test day.
1. Commutative: Numbers can swap places and still provide the same mathematical result. This is valid only for addition and multiplication. For example:
a + b = b + a → 3 + 4 = 4 + 3
a × b = b × a → 3 × 4 = 4 × 3
BUT: 3 − 4 ≠ 4 − 3 and 3 ÷ 4 ≠ 4 ÷ 3
2. Associative: Different number groupings will provide the same mathematical result. This is valid only for addition and multiplication. For example:
(a + b) + c = a + (b + c) → (4 + 5) + 6 = 4 + (5 + 6)
(a × b) × c = a × (b × c) → (4 × 5) × 6 = 4 × (5 × 6)
BUT: (4 − 5) − 6 ≠ 4 − (5 − 6) and (4 ÷ 5) ÷ 6 ≠ 4 ÷ (5 ÷ 6)
3. Distributive: A number that is multiplied by the sum or difference of two other numbers can be rewritten as the first number multiplied by the two others individually. This does not work with division. For example:
a(b + c) = ab + ac → 6(x + 3) = 6x + 6(3)
a(b − c) = ab − ac → 3(y − 2) = 3y + 3(—2)
BUT: 12 ÷ (6 + 2) ≠ 12 ÷ 6 + 12 ÷ 2
Note: When subtracting an expression in parentheses, such as in 4 − (x + 3), distribute the negative sign outside the parentheses first: 4 + (−x − 3) → 1 − x.
· Subtracting a positive number is the same as adding its negative. Likewise, subtracting a negative number is the same as adding its positive:
r − s = r + (−s) → 22 − 15 = 7 and 22 + (−15) = 7
r − (−s) = r + s → 22 − (−15) = 37 and 22 + 15 = 37
· You should be comfortable manipulating both proper and improper fractions.
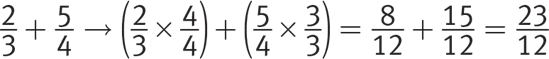
1. To add and subtract fractions, first find a common denominator, then add the numerators together:
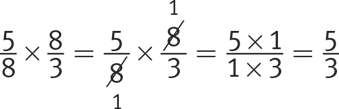
2. Multiplying fractions is straightforward: multiply the numerators together, then repeat for the denominators. Cancel when possible to simplify the answer:
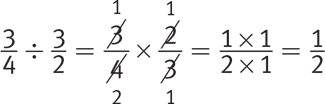
3. Dividing by a fraction is the same as multiplying by its reciprocal. Once you’ve rewritten a division problem as multiplication, follow the rules for fraction multiplication to simplify:
· Absolute value means the distance a number is from 0 on a number line. Because absolute value is a distance, it is always positive or 0. Absolute value can never be negative. For example:
![]()
· Whatever you do to one side of an equation, you must do to the other. For instance, if you multiply one side by 3, you must multiply the other side by 3 as well.
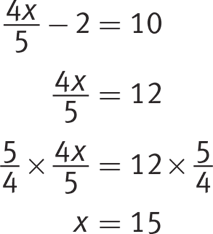
· The ability to solve straightforward, one-variable equations is critical on the PSAT. For example:
Note:  is the same as
  . You could see either form on the PSAT.
· You will encounter irrational numbers, such as common radicals and π, on test day. You can carry an irrational number through your calculations as you would a variable (e.g., ![]() ). Only convert to a decimal when you have finished any intermediate steps and when the question asks you to provide an approximate value.
). Only convert to a decimal when you have finished any intermediate steps and when the question asks you to provide an approximate value.
Mental Math
Even if you’re a math whiz, you need to adjust your thought process in terms of the PSAT to give yourself the biggest advantage you can. Knowing a few extra things, such as the below, will boost your speed on test day:
· Don’t abuse your calculator by using it to determine something as simple as 15 ÷ 3 (we’ve seen it many times). Besides, what if you’re in the middle of the no-calculator section? Save time on test day by reviewing multiplication tables. At a bare minimum, work up through the 10s. If you know them through 12 or 15, that’s even better!
· You can save a few seconds of number crunching by memorizing perfect squares. Knowing perfect squares through 10 is a good start; go for 15 or even 20 if you can.
· Percent means “out of a hundred.” For example,  . You can write percents as decimals (e.g., 27% = 0.27).
· The ability to recognize a few simple fractions masquerading in decimal or percent form will save you time on test day because you won’t have to turn to your calculator to convert them. Memorize the content of the following table.
|
Fraction |
Decimal |
Percent |
|
|
0.1 |
10% |
|
|
0.2 |
20% |
|
|
0.25 |
25% |
|
|
|
|
|
|
0.5 |
50% |
|
|
0.75 |
75% |
· Tip: If you don’t have the decimal (or percent) form of a multiple of one of the fractions shown in the table memorized, such as ![]() , just take the fraction with the corresponding denominator (
, just take the fraction with the corresponding denominator (![]() in this case), convert to a decimal (0.2), and multiply by the numerator of the desired fraction to get its decimal equivalent:
in this case), convert to a decimal (0.2), and multiply by the numerator of the desired fraction to get its decimal equivalent:
· 
Graphing
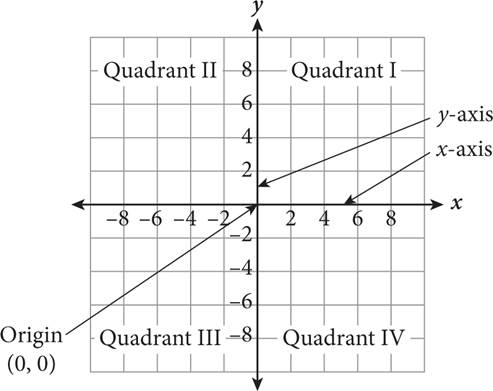
· Basic two-dimensional graphing is performed on a coordinate plane. There are two axes, x and y, that meet at a central point called the origin. Each axis has both positive and negative values that extend outward from the origin at evenly spaced intervals. The axes divide the space into four sections called quadrants, which are labeled I, II, III, and IV. Quadrant I is always the upper-right section, and the rest follow counterclockwise:
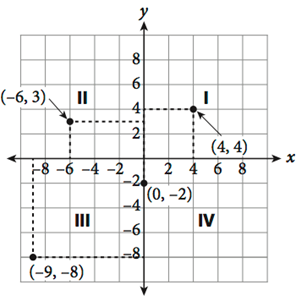
· To plot points on the coordinate plane, you need their coordinates. The x-coordinate is where the point falls along the x-axis, and the y-coordinate is where the point falls along the y-axis. The two coordinates together make an ordered pair written as (x, y). When writing ordered pairs, the x-coordinate is always listed first (think alphabetical order). Four points are plotted in the following figure as examples:
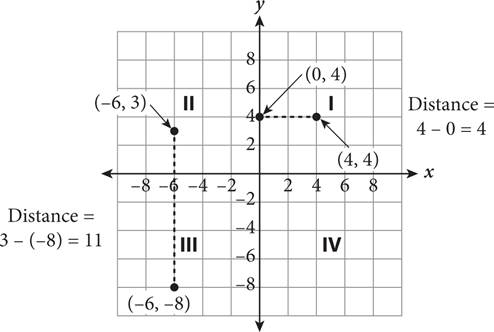
· When two points are vertically or horizontally aligned, calculating the distance between them is easy. For a horizontal distance, only the x-value changes; for a vertical distance, only the y-value changes. Take the positive difference of the x-coordinates (or y-coordinates) to determine the distance—that is, subtract the smaller number from the larger number so that the difference is positive. Two examples are presented here:
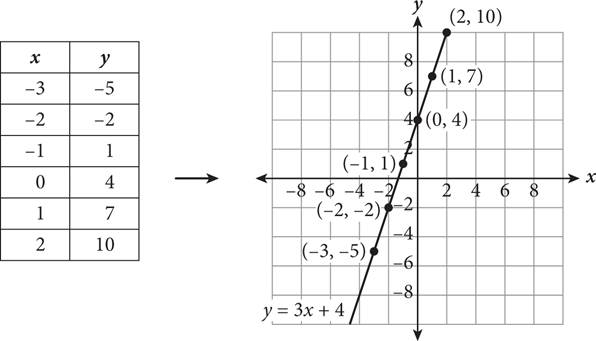
· Two-variable equations have an independent variable (input) and a dependent variable (output). The dependent variable (often y), depends on the independent variable (often x). For example, in the equation y = 3x + 4, x is the independent variable; any y-value depends on what you plug in for x. You can construct a table of values for the equation, which can then be plotted. For example:
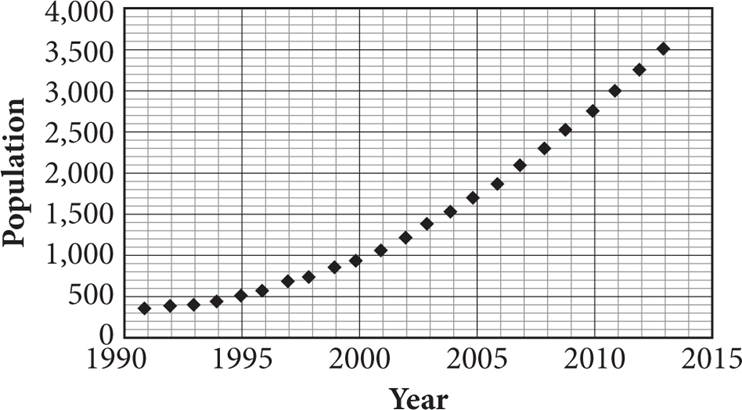
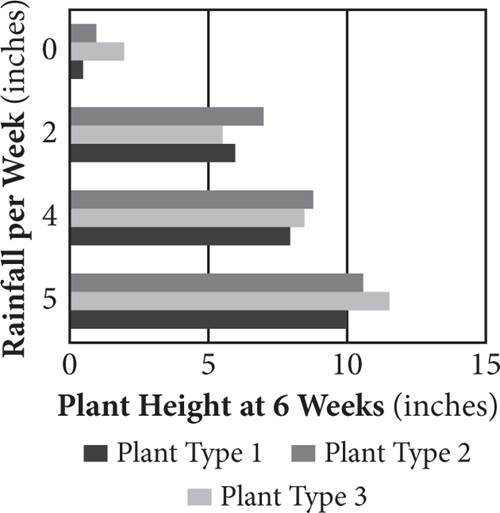
· You may be asked to infer relationships from graphs. In the first of the following graphs, the two variables are time and population. Clearly, the year does not depend on how many people live in the town; rather, the population increases over time and thus depends on the year. In the second graph, you can infer that plant height depends on the amount of rain; thus, rainfall is the independent variable. Note that the independent variable for the second graph is the vertical axis; this can happen with certain nonstandard graphs. On the standard coordinate plane, however, the independent variable is always plotted on the horizontal axis.
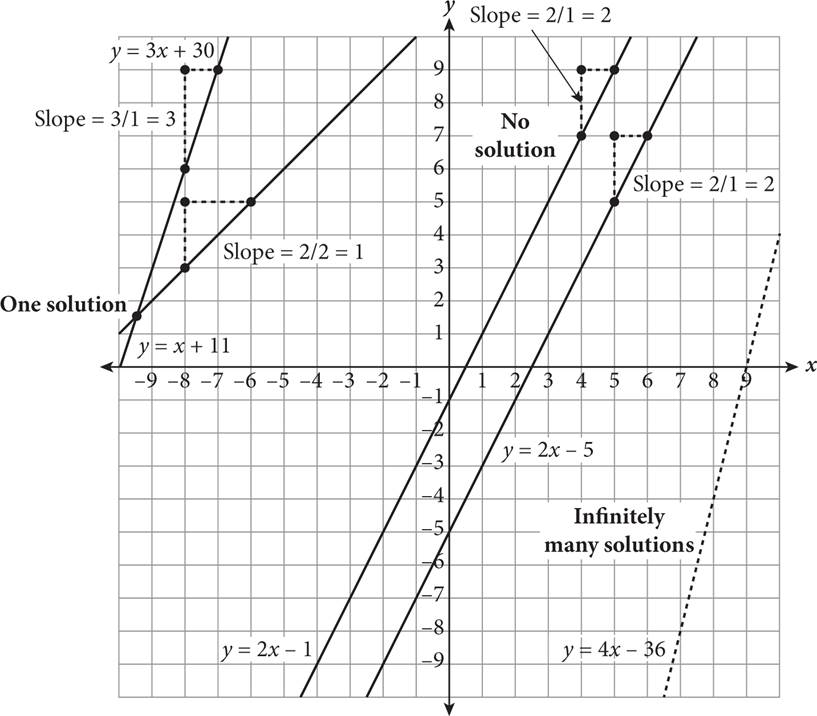
· When two straight lines are graphed simultaneously, one of three possible scenarios will occur:
1. The lines will not intersect at all (no solution).
2. The lines will intersect at one point (one solution).
3. The lines will lie on top of each other (infinitely many solutions).
Geometry
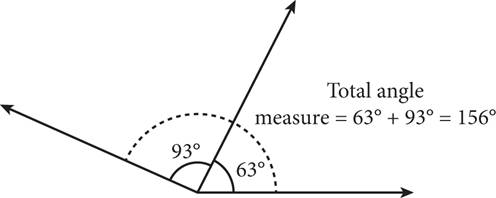
· Adjacent angles can be added to find the measure of a larger angle. The following diagram demonstrates this:
· Two angles that sum to 90° are called complementary angles. Two angles that sum to 180° are called supplementary angles.
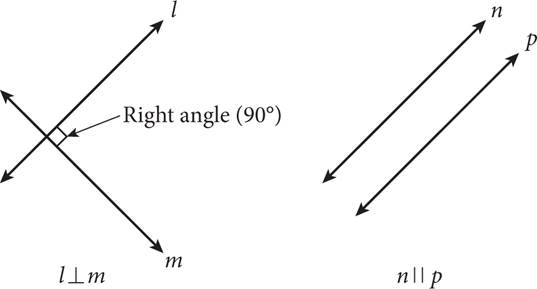
· Two distinct lines in a plane will either intersect at one point or extend indefinitely without intersecting. If two lines intersect at a right angle (90°), they are perpendicular and are denoted with ⊥. If the lines never intersect, they are parallel and are denoted with ||. For example:
· Perimeter and area are basic properties that all two-dimensional shapes have. The perimeter of a polygon can easily be calculated by adding the lengths of all its sides. Area is the amount of two-dimensional space a shape occupies. The most common shapes for which you’ll need these two properties on test day are triangles, parallelograms, and circles.
· The area (A) of a triangle is given by 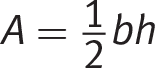 , where b is the base of the triangle and h is its height. The base and height are always perpendicular. Any side of a triangle can be used as the base; just make sure you use its corresponding height (a line segment perpendicular to the base, terminating in the opposite vertex). You can use a right triangle’s two legs as the base and height, but in non-right triangles, if the height is not given, you’ll need to draw it in (from the vertex of the angle opposite the base down to the base itself at a right angle) and compute it.
· The interior angles of a triangle sum to 180°. If you know any two interior angles, you can calculate the third.
· Parallelograms are quadrilaterals with two pairs of parallel sides. Rectangles and squares are subsets of parallelograms. You can find the area of a parallelogram using A = bh. As with triangles, you can use any side of a parallelogram as the base, and again, the height is perpendicular to the base. For a rectangle or square, use the side perpendicular to the base as the height. For any other parallelogram, the height (or enough information to find it) will be given.
· A circle’s perimeter is known as its circumference (C) and is found using C = 2πr, where r is the radius (distance from the center of the circle to its edge). The area of a circle is given by A = πr2. The strange symbol is the lowercase Greek letter pi (π, pronounced “pie”), which is approximately 3.14. As mentioned in the algebra section, you should carry π throughout your calculations without rounding unless instructed otherwise.
· A tangent line touches a circle at exactly one point and is perpendicular to a circle’s radius at the point of contact, as shown here:
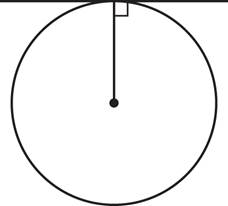
The presence of a right angle opens up the opportunity to draw otherwise hidden shapes, so pay special attention to tangents when they’re mentioned.
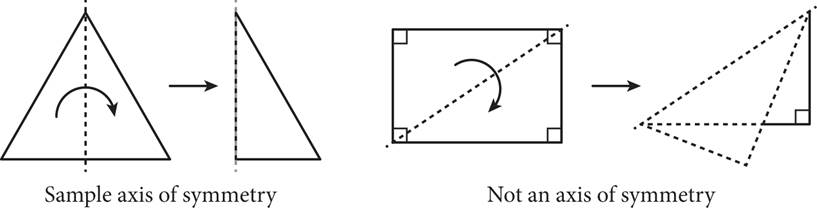
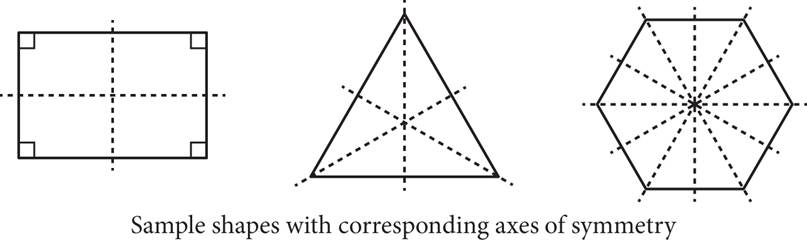
· A shape is said to have symmetry when it can be split by a line (called an axis of symmetry) into two identical parts. Consider folding a shape along a line: if all sides and vertices align once the shape is folded in half, the shape is symmetrical about that line. Some shapes have no axis of symmetry, some have one, some have multiple axes, and still others can have infinite axes of symmetry (e.g., a circle):
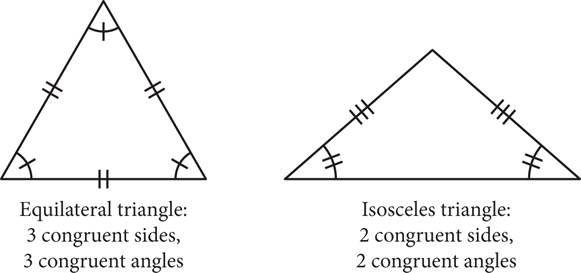
· Congruence is simply a geometry term that means identical. Angles, lines, and shapes can be congruent. Congruence is indicated by using hash marks. Everything with the same number of hash marks is congruent:
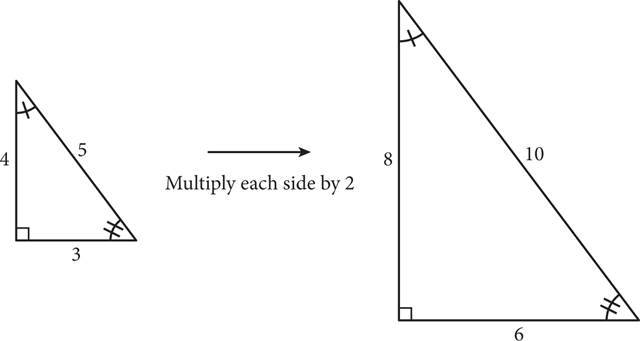
· Similarity between shapes indicates that they have identical angles and proportional sides. Think of taking a shape and stretching or shrinking each side by the same ratio. The resulting shape will have the same angles as the original. While the sides will not be identical, they will be proportional. For example:
If you’re comfortable with these concepts, read on for tips on calculator use. If not, review this lesson and remember to refer to it for help if you get stuck in a later chapter.
Calculator Use
Learning Objectives
After this lesson, you will be able to:
· Distinguish between questions that need a calculator and questions in which manual calculations are more efficient
CALCULATORS AND THE PSAT
Educators and parents believe that calculators serve a role in solving math questions, but they are sometimes concerned that students rely too heavily on calculators. They believe this dependence weakens students’ overall ability to think mathematically. Therefore, the PSAT has a policy on calculator use to promote the idea that students need to be able to analyze and solve math problems both with and without a calculator. The first math section you see will require you to work without a calculator, while the second math section will allow you to use one.
Many students never stop to ask whether using a calculator is the most efficient way to solve a problem. This chapter will show you how the strongest test takers use their calculators strategically; that is, they carefully evaluate when to use the calculator and when to skip it in favor of a more streamlined approach. As you will see, even though you can use a calculator, sometimes it’s more beneficial to save your energy by approaching a question more strategically. Work smarter, not harder.
WHICH CALCULATOR SHOULD YOU USE?
The PSAT allows four-function, scientific, and graphing calculators. No matter which calculator you choose, start practicing with it now. You don’t want to waste valuable time on test day looking for the exponent button or figuring out how to correctly graph equations. Due to the wide range of mathematics topics you’ll encounter on test day, we recommend using a graphing calculator, such as the TI-83/84. If you don’t already own one, see if you can borrow one from your school’s math department or a local library.
A graphing calculator’s capabilities extend well beyond what you’ll need for the test, so don’t worry about memorizing every function. The next few pages will cover which calculator functions you’ll want to know how to use for the PSAT. If you’re not already familiar with your graphing calculator, you’ll want to get the user manual; you can find this on the Internet by searching for your calculator’s model number. Identify the calculator functions necessary to answer various PSAT Math questions, then write down the directions for each to make a handy study sheet.
WHEN SHOULD YOU USE A CALCULATOR?
Some PSAT question types are designed based on the idea that students will do some or all of the work using a calculator. As a master test taker, you want to know what to look for so you can identify when calculator use is advantageous. Questions involving statistics, determining roots of complicated quadratic equations, and other topics are generally designed with calculator use in mind.
Other questions aren’t intentionally designed to involve calculator use. Solving some with a calculator can save you time and energy, but you’ll waste both if you go for the calculator on others. You will have to decide which method is best when you encounter the following topics:
· Long division and other extensive calculations
· Graphing quadratics
· Simplifying radicals and calculating roots
· Plane and coordinate geometry
Practicing long computations by hand and with the calculator will not only boost your focus and mental math prowess, but it will also help you determine whether it’s faster to do the work for a given question by hand or reach for the calculator on test day.
Graphing quadratic equations may be a big reason you got that fancy calculator in the first place; it makes answering these questions a snap! This is definitely an area where you need to have an in-depth knowledge of your calculator’s functions. The key to making these questions easy with the calculator is being meticulous when entering the equation.
Another stressful area for many students is radicals, especially when the answer choices are written as decimals. Those two elements are big red flags that trigger a reach for the calculator. Beware: not all graphing calculators have a built-in radical simplification function, so consider familiarizing yourself with this process.
Geometry can be a gray area for students when it comes to calculator use. Consider working by hand when dealing with angles and lines, specifically when filling in information on complementary, supplementary, and congruent angles. You should be able to work fluidly through those questions without using your calculator.
If you choose to use trigonometric functions to get to the answer on triangle questions, make sure you have your calculator set to degrees or radians as required by the question.
TO USE OR NOT TO USE?
A calculator is a double-edged sword on the PSAT: using one can be an asset for verifying work if you struggle when doing math by hand, but turning to it for the simplest computations will cost you time that you could devote to more complex questions. Practice solving questions with and without a calculator to get a sense of your personal style as well as your strengths and weaknesses. Think critically about when a calculator saves you time and when mental math is faster. Use the exercises in this book to practice your calculations so that by the time test day arrives, you’ll be in the habit of using your calculator as effectively as possible.